Monitoring คืออะไร? สอน Observability ตั้งแต่ Prometheus Grafana ELK Stack จนถึง Alerting 2026
Monitoring vs Observability — ต่างกันอย่างไร?
Monitoring คือกระบวนการเก็บรวบรวม วิเคราะห์ และแสดงผลข้อมูลเกี่ยวกับสถานะของระบบ เพื่อตรวจจับปัญหาและแจ้งเตือนเมื่อมีสิ่งผิดปกติเกิดขึ้น ลองจินตนาการว่า Monitoring เปรียบเหมือนเครื่องวัดต่างๆ ในรถยนต์ มาตรวัดความเร็ว มาตรวัดน้ำมัน สัญญาณไฟเตือนเครื่องยนต์ ที่คอยบอกสถานะของรถให้คุณรู้ตลอดเวลา เมื่อมีไฟเตือนติดขึ้น คุณรู้ว่ามีปัญหาเกิดขึ้น
Observability เป็นแนวคิดที่กว้างกว่า Monitoring หมายถึงความสามารถในการเข้าใจสถานะภายในของระบบจากข้อมูลที่ระบบส่งออกมา (Telemetry Data) โดยไม่ต้องรู้ล่วงหน้าว่าปัญหาคืออะไร ถ้า Monitoring คือการตรวจจับว่า "มีปัญหาเกิดขึ้น" Observability คือความสามารถที่จะบอกว่า "ทำไมปัญหาถึงเกิดขึ้น" ซึ่งสำคัญมากในระบบ Distributed Systems ที่มี Microservices หลายสิบหรือหลายร้อยตัวทำงานร่วมกัน
อ่านเพิ่ม: Prometheus และ Grafana คืออะไร? สอนสร้าง Monitoring Stack สำ · อ่านเพิ่ม: Observability และ OpenTelemetry คืออะไร? สอน Traces, Metrics · อ่านเพิ่ม: Incident Management คืออะไร? สอนจัดการ Incident และ On-Call
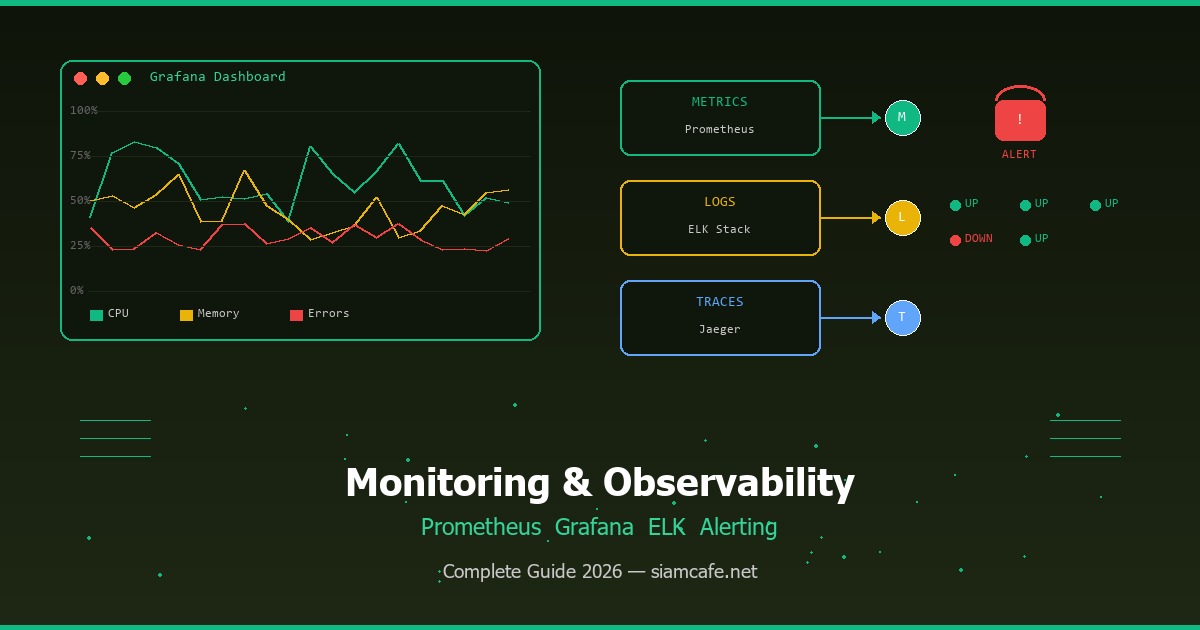
1. Metrics — ตัวเลขที่วัดสถานะของระบบในช่วงเวลาหนึ่ง (เช่น CPU Usage 75%, Request Rate 500 req/s)
2. Logs — บันทึกเหตุการณ์ที่เกิดขึ้นในระบบ (เช่น "User 123 login failed: invalid password")
3. Traces — เส้นทางของ Request ตั้งแต่ต้นจนจบ ผ่านหลาย Services (เช่น API Gateway → Auth → Order → Payment → Notification)
ทำไมต้อง Monitor? — ต้นทุนของ Downtime
การไม่มี Monitoring เท่ากับขับรถโดยไม่มีมาตรวัดใดๆ คุณไม่รู้ว่าเครื่องยนต์ร้อนจัดจนกว่ามันจะพัง ในโลกซอฟต์แวร์ Downtime มีต้นทุนสูงมาก ข้อมูลจาก Gartner ระบุว่า Downtime เฉลี่ยมีค่าใช้จ่าย $5,600 ต่อนาที หรือกว่า $300,000 ต่อชั่วโมง สำหรับองค์กรขนาดใหญ่ Amazon เคยสูญรายได้กว่า $100 ล้านดอลลาร์จาก Downtime เพียง 1 ชั่วโมงในช่วง Prime Day
SLA, SLO & SLI — ข้อตกลงระดับบริการ
การทำ Monitoring ที่ดีต้องมีเป้าหมายที่ชัดเจน ซึ่งกำหนดผ่าน SLA, SLO และ SLI
| คำย่อ | ชื่อเต็ม | คำอธิบาย | ตัวอย่าง |
|---|---|---|---|
| SLA | Service Level Agreement | ข้อตกลงกับลูกค้า (สัญญา) | Uptime 99.9%, ถ้าต่ำกว่าจ่ายค่าชดเชย |
| SLO | Service Level Objective | เป้าหมายภายในทีม (เข้มกว่า SLA) | Uptime 99.95%, Latency p99 < 200ms |
| SLI | Service Level Indicator | ตัวชี้วัดจริงที่วัดได้ | Uptime เดือนนี้ = 99.97%, p99 = 180ms |
ตัวอย่าง Uptime ตามระดับ SLA
SLA 99% = Downtime 87.6 ชั่วโมง/ปี (3.65 วัน)
SLA 99.9% = Downtime 8.76 ชั่วโมง/ปี (~8.7 ชม.)
SLA 99.95% = Downtime 4.38 ชั่วโมง/ปี (~4.4 ชม.)
SLA 99.99% = Downtime 52.6 นาที/ปี (~53 นาที)
SLA 99.999% = Downtime 5.26 นาที/ปี (~5 นาที) — "Five Nines"
ยิ่งตัวเลขสูง ยิ่งต้องลงทุนด้าน Monitoring และ Redundancy มากขึ้น
Metrics — ตัวเลขที่บอกสถานะระบบ
Prometheus — ระบบเก็บ Metrics ยอดนิยม
Prometheus เป็น Open-source Monitoring System ที่พัฒนาโดย SoundCloud และปัจจุบันเป็นโปรเจกต์ภายใต้ CNCF (Cloud Native Computing Foundation) ร่วมกับ Kubernetes Prometheus ถูกออกแบบมาสำหรับระบบ Cloud-native โดยเฉพาะ มีจุดเด่นคือ Pull-based Model ที่ Prometheus จะดึง (Scrape) Metrics จาก Target ทุกๆ ช่วงเวลาที่กำหนด (เช่นทุก 15 วินาที) แทนที่จะให้แอปพลิเคชัน Push Metrics เข้ามา
Prometheus Architecture
สถาปัตยกรรม Prometheus
[Application] --expose /metrics--> [Prometheus Server] --> [Grafana]
[Node Exporter] --scrape---/ |
[cAdvisor] --scrape---/ |
[kube-state] --scrape---/ v
[Alertmanager] --> Slack/Email/PagerDuty
ติดตั้ง Prometheus ด้วย Docker
docker run -d --name prometheus -p 9090:9090 -v /etc/prometheus/prometheus.yml:/etc/prometheus/prometheus.yml prom/prometheus
# prometheus.yml — ไฟล์ Config หลัก
global:
  scrape_interval: 15s          # ดึง Metrics ทุก 15 วินาที
  evaluation_interval: 15s      # ประเมิน Rules ทุก 15 วินาที
  scrape_timeout: 10s           # Timeout สำหรับแต่ละ Scrape

# Alerting Rules
rule_files:
  - "alert_rules.yml"

# Alertmanager Configuration
alerting:
  alertmanagers:
    - static_configs:
        - targets: ["alertmanager:9093"]

# Scrape Configuration — กำหนด Target ที่จะดึง Metrics
scrape_configs:
  # Monitor Prometheus เอง
  - job_name: "prometheus"
    static_configs:
      - targets: ["localhost:9090"]

  # Monitor Node (CPU, Memory, Disk)
  - job_name: "node-exporter"
    static_configs:
      - targets: ["node-exporter:9100"]

  # Monitor Application
  - job_name: "my-api"
    metrics_path: "/metrics"
    scrape_interval: 10s
    static_configs:
      - targets: ["api-server:3000"]

  # Service Discovery สำหรับ Kubernetes
  - job_name: "kubernetes-pods"
    kubernetes_sd_configs:
      - role: pod
    relabel_configs:
      - source_labels: [__meta_kubernetes_pod_annotation_prometheus_io_scrape]
        action: keep
        regex: true
PromQL — ภาษา Query ของ Prometheus
PromQL (Prometheus Query Language) เป็นภาษาเฉพาะสำหรับ Query ข้อมูล Metrics จาก Prometheus มีความสามารถสูงในการคำนวณ Rate, Aggregation, และ Filtering
# PromQL ตัวอย่างที่ใช้บ่อย

# 1. CPU Usage เป็นเปอร์เซ็นต์ (ใช้กับ Node Exporter)
100 - (avg by(instance) (irate(node_cpu_seconds_total{mode="idle"}[5m])) * 100)

# 2. Memory Usage เป็นเปอร์เซ็นต์
(1 - (node_memory_MemAvailable_bytes / node_memory_MemTotal_bytes)) * 100

# 3. HTTP Request Rate (requests per second)
rate(http_requests_total[5m])

# 4. HTTP Request Rate แยกตาม Status Code
sum by(status_code) (rate(http_requests_total[5m]))

# 5. Error Rate (เฉพาะ 5xx)
sum(rate(http_requests_total{status_code=~"5.."}[5m]))
  /
sum(rate(http_requests_total[5m])) * 100

# 6. Latency Percentile (p99)
histogram_quantile(0.99, sum by(le) (rate(http_request_duration_seconds_bucket[5m])))

# 7. Disk Usage เป็นเปอร์เซ็นต์
(1 - (node_filesystem_avail_bytes / node_filesystem_size_bytes)) * 100

# 8. Container CPU Usage (สำหรับ Docker/Kubernetes)
sum by(container) (rate(container_cpu_usage_seconds_total[5m]))

# 9. Top 5 API Endpoints ที่ช้าที่สุด
topk(5, avg by(endpoint) (rate(http_request_duration_seconds_sum[5m])
  / rate(http_request_duration_seconds_count[5m])))

# 10. Alerting Rule — แจ้งเตือนเมื่อ Error Rate สูงกว่า 5%
# (ใส่ใน alert_rules.yml)
groups:
  - name: api-alerts
    rules:
      - alert: HighErrorRate
        expr: sum(rate(http_requests_total{status_code=~"5.."}[5m]))
              / sum(rate(http_requests_total[5m])) > 0.05
        for: 5m
        labels:
          severity: critical
        annotations:
          summary: "High error rate detected"
          description: "Error rate is above 5% for 5 minutes"
Exporters — ตัวแปลง Metrics
Exporter คือโปรแกรมที่ดึง Metrics จากระบบต่างๆ แล้วแปลงให้อยู่ในรูปแบบที่ Prometheus เข้าใจ Exporter ที่ใช้บ่อยได้แก่
| Exporter | ใช้ Monitor อะไร | Metrics ที่ได้ |
|---|---|---|
| Node Exporter | Linux Server | CPU, Memory, Disk, Network, Filesystem |
| cAdvisor | Docker Containers | Container CPU, Memory, Network I/O |
| kube-state-metrics | Kubernetes | Pod Status, Deployment Replicas, Node Status |
| MySQL Exporter | MySQL/MariaDB | Queries, Connections, Replication Lag |
| Redis Exporter | Redis | Connected Clients, Memory, Hit Rate |
| Nginx Exporter | Nginx | Connections, Requests, Response Time |
| Blackbox Exporter | External Endpoints | HTTP Probe, DNS, TCP, ICMP |
Visualization — Grafana Dashboard
Grafana เป็น Open-source Visualization Platform ที่ได้รับความนิยมสูงสุดในวงการ Monitoring รองรับ Data Source หลายตัวรวมถึง Prometheus, Elasticsearch, InfluxDB, CloudWatch, Datadog และอีกมากมาย Grafana ช่วยสร้าง Dashboard ที่สวยงาม Interactive และแชร์กับทีมได้ง่าย
ติดตั้ง Grafana ด้วย Docker
docker run -d --name grafana -p 3000:3000 -e GF_SECURITY_ADMIN_PASSWORD=admin123 -v grafana-storage:/var/lib/grafana grafana/grafana
เข้าใช้งาน: http://localhost:3000
Default login: admin / admin123
Grafana Dashboard Components
- Panels — กราฟแต่ละตัวใน Dashboard รองรับหลายรูปแบบ ได้แก่ Time Series (เส้นกราฟเวลา), Gauge (มาตรวัด), Stat (ตัวเลขเดี่ยว), Bar Chart, Table, Heatmap, Histogram, Logs Panel
- Variables — ตัวแปรที่ทำให้ Dashboard Dynamic เลือกเปลี่ยน Environment, Server, Application ผ่าน Dropdown ได้ ไม่ต้องสร้าง Dashboard ซ้ำหลายตัว
- Annotations — เครื่องหมายบนกราฟที่แสดงเหตุการณ์สำคัญ เช่น Deployment, Incident, Config Change ช่วยให้เห็นความสัมพันธ์ระหว่างเหตุการณ์กับ Metrics
- Alerts — Grafana มีระบบ Alerting ในตัว สามารถตั้งเงื่อนไขและแจ้งเตือนผ่าน Slack, Email, PagerDuty, Discord, Telegram ได้
# ตัวอย่าง Grafana Dashboard JSON (provisioning)
{
  "dashboard": {
    "title": "API Monitoring Dashboard",
    "panels": [
      {
        "title": "Request Rate",
        "type": "timeseries",
        "datasource": "Prometheus",
        "targets": [
          {
            "expr": "sum(rate(http_requests_total[5m])) by (method)",
            "legendFormat": "{{method}}"
          }
        ]
      },
      {
        "title": "Error Rate %",
        "type": "gauge",
        "datasource": "Prometheus",
        "targets": [
          {
            "expr": "sum(rate(http_requests_total{status_code=~'5..'}[5m])) / sum(rate(http_requests_total[5m])) * 100"
          }
        ],
        "fieldConfig": {
          "defaults": {
            "thresholds": {
              "steps": [
                { "color": "green", "value": 0 },
                { "color": "yellow", "value": 1 },
                { "color": "red", "value": 5 }
              ]
            }
          }
        }
      },
      {
        "title": "Response Time (p99)",
        "type": "stat",
        "datasource": "Prometheus",
        "targets": [
          {
            "expr": "histogram_quantile(0.99, sum by(le) (rate(http_request_duration_seconds_bucket[5m])))"
          }
        ]
      }
    ]
  }
}
Logging — บันทึกเหตุการณ์ในระบบ
ELK Stack — Elasticsearch + Logstash + Kibana
ELK Stack เป็นชุดเครื่องมือสำหรับ Log Management ที่ได้รับความนิยมสูงสุด ประกอบด้วยสามส่วนหลัก
- Elasticsearch — Search Engine ที่ใช้เก็บและค้นหา Log ข้อมูลขนาดใหญ่ได้อย่างรวดเร็ว สร้างบน Apache Lucene รองรับ Full-text Search, Aggregation, และ Real-time Analysis
- Logstash — Pipeline สำหรับรวบรวม แปลงรูปแบบ (Transform) และส่ง Log ไปยัง Elasticsearch รองรับ Input หลายร้อยแหล่ง ได้แก่ File, Syslog, Kafka, Redis, HTTP และ Filter Plugin มากมาย เช่น Grok, Mutate, Date, GeoIP
- Kibana — Web UI สำหรับค้นหา วิเคราะห์ และแสดงผล Log ในรูปแบบ Dashboard สร้าง Visualization ได้หลากหลาย ตั้งแต่ Line Chart, Bar Chart, Pie Chart จนถึง Map, Lens และ Canvas
# docker-compose.yml สำหรับ ELK Stack
version: "3.8"
services:
  elasticsearch:
    image: docker.elastic.co/elasticsearch/elasticsearch:8.12.0
    environment:
      - discovery.type=single-node
      - xpack.security.enabled=false
      - "ES_JAVA_OPTS=-Xms512m -Xmx512m"
    ports:
      - "9200:9200"
    volumes:
      - es-data:/usr/share/elasticsearch/data

  logstash:
    image: docker.elastic.co/logstash/logstash:8.12.0
    ports:
      - "5044:5044"   # Beats input
      - "5000:5000"   # TCP input
    volumes:
      - ./logstash/pipeline:/usr/share/logstash/pipeline
    depends_on:
      - elasticsearch

  kibana:
    image: docker.elastic.co/kibana/kibana:8.12.0
    ports:
      - "5601:5601"
    environment:
      - ELASTICSEARCH_HOSTS=http://elasticsearch:9200
    depends_on:
      - elasticsearch

volumes:
  es-data:
# logstash/pipeline/logstash.conf
input {
beats {
port => 5044
}
tcp {
port => 5000
codec => json
}
}
filter {
# Parse JSON logs
if [message] =~ /^\{/ {
json {
source => "message"
}
}
# Parse Nginx access logs
if [type] == "nginx-access" {
grok {
match => { "message" => "%{COMBINEDAPACHELOG}" }
}
geoip {
source => "clientip"
}
}
# Add timestamp
date {
match => [ "timestamp", "ISO8601", "yyyy-MM-dd HH:mm:ss" ]
}
# Remove unnecessary fields
mutate {
remove_field => ["host", "agent"]
}
}
output {
elasticsearch {
hosts => ["elasticsearch:9200"]
index => "logs-%{+YYYY.MM.dd}"
}
}Loki + Grafana — ทางเลือกที่เบากว่า ELK
Grafana Loki เป็นระบบ Log Aggregation ที่ออกแบบมาให้ใช้ง่ายและเบากว่า ELK Stack แนวคิดของ Loki คือ "Prometheus แต่สำหรับ Logs" ไม่ Index เนื้อหา Log ทั้งหมดเหมือน Elasticsearch แต่ Index แค่ Labels ทำให้ใช้ Storage น้อยกว่ามาก เหมาะสำหรับทีมที่ใช้ Grafana อยู่แล้วและต้องการเพิ่มความสามารถด้าน Logging
# ติดตั้ง Loki + Promtail ด้วย Docker
docker run -d --name loki -p 3100:3100 grafana/loki
docker run -d --name promtail   -v /var/log:/var/log   -v ./promtail-config.yml:/etc/promtail/config.yml   grafana/promtail -config.file=/etc/promtail/config.yml

# promtail-config.yml — Agent ที่ส่ง Log ไปยัง Loki
server:
  http_listen_port: 9080

positions:
  filename: /tmp/positions.yaml

clients:
  - url: http://loki:3100/loki/api/v1/push

scrape_configs:
  - job_name: system
    static_configs:
      - targets: [localhost]
        labels:
          job: varlogs
          __path__: /var/log/*.log

  - job_name: docker
    docker_sd_configs:
      - host: unix:///var/run/docker.sock
    relabel_configs:
      - source_labels: [__meta_docker_container_name]
        target_label: container
Structured Logging — Log แบบมีโครงสร้าง
Structured Logging คือการเขียน Log ในรูปแบบ JSON แทนข้อความธรรมดา ทำให้ค้นหา กรอง และวิเคราะห์ Log ได้ง่ายขึ้นมาก
# ตัวอย่าง Structured Logging (Python)
import logging
import json
from datetime import datetime

class JSONFormatter(logging.Formatter):
    def format(self, record):
        log_entry = {
            "timestamp": datetime.utcnow().isoformat(),
            "level": record.levelname,
            "logger": record.name,
            "message": record.getMessage(),
            "module": record.module,
            "function": record.funcName,
            "line": record.lineno,
        }
        if record.exc_info:
            log_entry["exception"] = self.formatException(record.exc_info)
        if hasattr(record, "request_id"):
            log_entry["request_id"] = record.request_id
        if hasattr(record, "user_id"):
            log_entry["user_id"] = record.user_id
        return json.dumps(log_entry, ensure_ascii=False)

# ผลลัพธ์ Log
# ไม่ดี (Unstructured):
# 2026-04-08 10:30:00 ERROR Failed to process order 12345 for user 67890

# ดี (Structured JSON):
# {
#   "timestamp": "2026-04-08T10:30:00Z",
#   "level": "ERROR",
#   "message": "Failed to process order",
#   "order_id": 12345,
#   "user_id": 67890,
#   "error": "Payment gateway timeout",
#   "duration_ms": 30000,
#   "request_id": "req-abc-123"
# }
Log Levels — ระดับความสำคัญ
| Level | คำอธิบาย | ใช้เมื่อ |
|---|---|---|
| DEBUG | ข้อมูลรายละเอียดสำหรับ Debug | พัฒนาและ Debug เท่านั้น ไม่เปิดใน Production |
| INFO | เหตุการณ์ปกติ | User login, Order created, Service started |
| WARN | สิ่งผิดปกติแต่ยังทำงานได้ | Retry attempt, Disk usage 80%, Deprecated API |
| ERROR | ข้อผิดพลาดที่ต้องแก้ไข | Database connection failed, Payment failed |
| FATAL/CRITICAL | ข้อผิดพลาดร้ายแรง ระบบใช้งานไม่ได้ | Application crash, Data corruption |
Tracing — ติดตามเส้นทาง Request
Distributed Tracing คือการติดตามเส้นทางของ Request เมื่อมันเดินทางผ่านหลาย Services ในระบบ Microservices ช่วยให้เข้าใจว่า Request ใช้เวลาที่ไหนนานที่สุด Service ไหนเป็นคอขวด และ Error เกิดที่จุดไหน
Jaeger & OpenTelemetry
Jaeger (พัฒนาโดย Uber, ปัจจุบันอยู่ภายใต้ CNCF) และ Zipkin (พัฒนาโดย Twitter) เป็น Distributed Tracing System ที่ได้รับความนิยม ในปัจจุบัน OpenTelemetry (OTel) กลายเป็นมาตรฐานของอุตสาหกรรม เป็น Framework ที่รวม Metrics, Logs และ Traces เข้าด้วยกัน รองรับหลายภาษาและ Backend
# ติดตั้ง Jaeger ด้วย Docker (All-in-one สำหรับ Development)
docker run -d --name jaeger   -p 16686:16686 \  # Jaeger UI
  -p 14268:14268 \  # HTTP collector
  -p 4317:4317 \    # OpenTelemetry gRPC
  -p 4318:4318 \    # OpenTelemetry HTTP
  jaegertracing/all-in-one:latest
# OpenTelemetry + Python (FastAPI)
# pip install opentelemetry-api opentelemetry-sdk opentelemetry-instrumentation-fastapi
from opentelemetry import trace
from opentelemetry.sdk.trace import TracerProvider
from opentelemetry.sdk.trace.export import BatchSpanProcessor
from opentelemetry.exporter.jaeger.thrift import JaegerExporter
from opentelemetry.instrumentation.fastapi import FastAPIInstrumentor
# Setup Tracer
tracer_provider = TracerProvider()
jaeger_exporter = JaegerExporter(
agent_host_name="jaeger",
agent_port=6831,
)
tracer_provider.add_span_processor(BatchSpanProcessor(jaeger_exporter))
trace.set_tracer_provider(tracer_provider)
tracer = trace.get_tracer(__name__)
# Auto-instrument FastAPI
app = FastAPI()
FastAPIInstrumentor.instrument_app(app)
# Manual Span สำหรับ Business Logic
@app.post("/orders")
async def create_order(order: OrderCreate):
with tracer.start_as_current_span("create_order") as span:
span.set_attribute("order.total", order.total)
span.set_attribute("order.items_count", len(order.items))
# ขั้นตอนย่อย
with tracer.start_as_current_span("validate_inventory"):
await validate_inventory(order.items)
with tracer.start_as_current_span("process_payment"):
payment = await process_payment(order.total)
span.set_attribute("payment.id", payment.id)
with tracer.start_as_current_span("send_notification"):
await send_notification(order.user_id)
return {"order_id": order.id, "status": "created"}Alerting — การแจ้งเตือน
Monitoring ที่ดีต้องมี Alerting ที่ฉลาด ไม่ใช่แค่ส่งเตือนเมื่อมีปัญหา แต่ต้องส่งเตือนอย่างเหมาะสม ไม่มากจนเกิด Alert Fatigue (เบื่อหน่ายจน ignore alert) และไม่น้อยจนพลาดปัญหาสำคัญ
Alertmanager — ศูนย์กลางการจัดการ Alert
# alertmanager.yml — Configuration สำหรับ Prometheus Alertmanager
global:
  resolve_timeout: 5m
  slack_api_url: "https://hooks.slack.com/services/YOUR/SLACK/WEBHOOK"

# Route — กำหนดเส้นทาง Alert
route:
  receiver: "slack-default"
  group_by: ["alertname", "severity"]
  group_wait: 30s          # รอ 30 วินาทีก่อนส่ง (รวม Alert ที่เกิดพร้อมกัน)
  group_interval: 5m       # รวม Alert ซ้ำทุก 5 นาที
  repeat_interval: 4h      # ส่งซ้ำทุก 4 ชั่วโมงถ้ายังไม่ Resolve

  routes:
    # Critical — ส่ง PagerDuty ทันที
    - match:
        severity: critical
      receiver: "pagerduty-critical"
      repeat_interval: 1h

    # Warning — ส่ง Slack
    - match:
        severity: warning
      receiver: "slack-warning"

    # Info — ส่ง Email
    - match:
        severity: info
      receiver: "email-team"

receivers:
  - name: "slack-default"
    slack_configs:
      - channel: "#alerts"
        title: "{ '{' } .GroupLabels.alertname { '}' }"
        text: "{ '{' } range .Alerts { '}' }*{ '{' } .Annotations.summary { '}' }*
{ '{' } .Annotations.description { '}' }
{ '{' } end { '}' }"

  - name: "slack-warning"
    slack_configs:
      - channel: "#alerts-warning"

  - name: "pagerduty-critical"
    pagerduty_configs:
      - service_key: "YOUR_PAGERDUTY_KEY"
        severity: critical

  - name: "email-team"
    email_configs:
      - to: "team@example.com"
        from: "alertmanager@example.com"
        smarthost: "smtp.gmail.com:587"

# Inhibition Rules — ลดการแจ้งเตือนซ้ำซ้อน
inhibit_rules:
  - source_match:
      severity: critical
    target_match:
      severity: warning
    equal: ["alertname", "instance"]
Infrastructure Monitoring
นอกจาก Application Monitoring แล้ว ต้อง Monitor Infrastructure ด้วย ได้แก่ Server, Container, Network และ Kubernetes Cluster
Node Exporter — Monitor Linux Server
ติดตั้ง Node Exporter
docker run -d --name node-exporter --net=host --pid=host -v /:/host:ro prom/node-exporter --path.rootfs=/host
Metrics ที่สำคัญ
node_cpu_seconds_total — CPU Usage
node_memory_MemAvailable_bytes — Available Memory
node_filesystem_avail_bytes — Disk Available
node_network_receive_bytes_total — Network Receive
node_load1, node_load5, node_load15 — System Load
cAdvisor — Monitor Docker Containers
ติดตั้ง cAdvisor
docker run -d --name cadvisor -p 8080:8080 -v /:/rootfs:ro -v /var/run:/var/run:rw -v /sys:/sys:ro -v /var/lib/docker:/var/lib/docker:ro gcr.io/cadvisor/cadvisor
Metrics ที่สำคัญ
container_cpu_usage_seconds_total — CPU ของแต่ละ Container
container_memory_usage_bytes — Memory ของแต่ละ Container
container_network_receive_bytes_total — Network I/O
container_fs_usage_bytes — Filesystem Usage
kube-state-metrics — Monitor Kubernetes
# Metrics ที่สำคัญสำหรับ Kubernetes
# kube_pod_status_phase                  — Pod Status (Running, Pending, Failed)
# kube_deployment_spec_replicas          — จำนวน Replicas ที่ต้องการ
# kube_deployment_status_replicas_ready  — จำนวน Replicas ที่พร้อม
# kube_node_status_condition             — Node Condition (Ready, MemoryPressure)
# kube_pod_container_status_restarts_total — จำนวนครั้งที่ Container Restart

# Alert: Pod CrashLoopBackOff
- alert: PodCrashLoopBackOff
  expr: rate(kube_pod_container_status_restarts_total[15m]) > 0
  for: 5m
  labels:
    severity: warning
  annotations:
    summary: "Pod is crash looping"

# Alert: Deployment Replicas Mismatch
- alert: DeploymentReplicasMismatch
  expr: kube_deployment_spec_replicas != kube_deployment_status_replicas_ready
  for: 10m
  labels:
    severity: warning
  annotations:
    summary: "Deployment replicas mismatch"
APM — Application Performance Monitoring
APM คือการ Monitor Performance ในระดับ Application ไม่ใช่แค่ Server Metrics แต่เข้าไปถึง Code Level เช่น Slow Database Queries, Memory Leaks, N+1 Query Problems, Third-party API Latency
เครื่องมือ APM ที่นิยม
| เครื่องมือ | ประเภท | จุดเด่น | ราคา |
|---|---|---|---|
| Datadog | SaaS | All-in-one, ใช้งานง่าย, Integration มาก | จ่ายตาม Host |
| New Relic | SaaS | APM ชั้นนำ, Full Stack Observability | 100GB ฟรี/เดือน |
| Elastic APM | Open-source / SaaS | รวมกับ ELK Stack, Self-hosted ได้ | ฟรี (Self-hosted) |
| Grafana Tempo | Open-source | Distributed Tracing, ใช้ร่วมกับ Grafana | ฟรี |
| SigNoz | Open-source | All-in-one OSS alternative, OpenTelemetry native | ฟรี |
SRE Practices — Site Reliability Engineering
SRE เป็นแนวปฏิบัติที่ Google คิดค้นขึ้น ผสมผสาน Software Engineering กับ Operations เพื่อสร้างระบบที่ Reliable และ Scalable Monitoring เป็นหัวใจสำคัญของ SRE
Error Budgets — งบประมาณความผิดพลาด
Error Budget คือจำนวนความผิดพลาดที่ยอมรับได้ ถ้า SLO กำหนดว่า Availability ต้อง 99.9% หมายความว่ามี Error Budget 0.1% เมื่อ Error Budget ใกล้หมด ทีมต้องหยุดปล่อยฟีเจอร์ใหม่และ Focus ที่ Reliability แทน
คำนวณ Error Budget
SLO: 99.9% availability
Error Budget = 100% - 99.9% = 0.1%
ต่อเดือน (30 วัน): 0.1% * 30 * 24 * 60 = 43.2 นาที
หมายความว่า Downtime ได้ไม่เกิน 43.2 นาที/เดือน
PromQL: ตรวจสอบ Error Budget ที่เหลือ
1 - (
sum(rate(http_requests_total{status_code=~"5.."}[30d]))
/ sum(rate(http_requests_total[30d]))
) / (1 - 0.999)
ผลลัพธ์ 0.5 หมายความว่า ใช้ Error Budget ไป 50% แล้ว
Incident Management — จัดการเหตุการณ์ผิดปกติ
- Detection — ตรวจพบปัญหาจาก Alert หรือ Dashboard ยิ่งตรวจพบเร็วเท่าไหร่ ยิ่งลดผลกระทบได้มาก MTTD (Mean Time to Detect) ควรต่ำที่สุด
- Response — ตอบสนองต่อ Alert มอบหมายผู้รับผิดชอบ เปิดช่องทางสื่อสาร (Incident Channel) MTTR (Mean Time to Respond) ควรต่ำ
- Mitigation — บรรเทาผลกระทบ อาจ Rollback, Scale Up, Redirect Traffic, หรือ Switch to Failover ยังไม่ต้อง Fix Root Cause แค่ทำให้ระบบกลับมาทำงานได้ก่อน
- Resolution — แก้ไขต้นเหตุของปัญหา Deploy Fix, Patch Configuration, Fix Data
- Postmortem — เขียน Blameless Postmortem เพื่อเรียนรู้จากเหตุการณ์ ระบุ Timeline, Root Cause, Impact, Action Items เพื่อป้องกันไม่ให้เกิดขึ้นอีก
Postmortem Template
# Postmortem: API Outage 8 April 2026
## Summary
API service went down for 23 minutes due to database connection pool exhaustion.

## Timeline (UTC)
- 10:15 — Alert: High error rate (>5%) triggered
- 10:17 — On-call engineer acknowledged, started investigation
- 10:22 — Root cause identified: DB connection pool exhausted
- 10:25 — Mitigation: Increased pool size, restarted service
- 10:38 — Service fully recovered, error rate back to normal

## Root Cause
A new feature deployed at 09:00 introduced a database query
that didn't properly close connections. Under peak load,
all 50 connections were consumed within 75 minutes.

## Impact
- 23 minutes of degraded service
- ~2,400 failed API requests (0.3% of daily traffic)
- Error Budget consumed: 35% of monthly budget

## Action Items
- [ ] Fix connection leak in order-service (P0)
- [ ] Add connection pool metrics to dashboard (P1)
- [ ] Add alert for connection pool usage > 80% (P1)
- [ ] Add integration test for connection cleanup (P2)
FAQ — คำถามที่พบบ่อยเกี่ยวกับ Monitoring
Q: ต้อง Monitor อะไรบ้างเป็นอย่างน้อย?
A: เริ่มจาก 4 Golden Signals ของ Google SRE ได้แก่ 1) Latency — เวลาตอบสนอง 2) Traffic — จำนวน Request 3) Errors — อัตราข้อผิดพลาด 4) Saturation — การใช้งาน Resource (CPU, Memory, Disk) สี่ตัวนี้ครอบคลุมปัญหาส่วนใหญ่ที่จะเกิดขึ้น
Q: ใช้ Prometheus + Grafana หรือ ELK Stack?
A: ทั้งสองมีจุดประสงค์ต่างกัน Prometheus + Grafana เหมาะสำหรับ Metrics (ตัวเลข Time-series) ส่วน ELK Stack เหมาะสำหรับ Logs (ข้อความ) ในทางปฏิบัติมักใช้ทั้งคู่ Prometheus สำหรับ Dashboard และ Alert ส่วน ELK สำหรับ Log Analysis และ Troubleshooting
Q: Monitoring กับ Observability ต่างกันอย่างไร?
A: Monitoring บอกว่า "มีปัญหาเกิดขึ้น" (what) ส่วน Observability บอกว่า "ทำไมปัญหาถึงเกิดขึ้น" (why) Monitoring เป็นส่วนหนึ่งของ Observability ระบบที่ Observable ต้องมี Metrics, Logs และ Traces ครบทั้ง 3 Pillars เพื่อให้สามารถวินิจฉัยปัญหาที่ไม่เคยเกิดขึ้นมาก่อนได้
Q: มี Alert เยอะเกินไป (Alert Fatigue) ทำอย่างไร?
A: 1) ตรวจสอบว่าทุก Alert มี Action ที่ชัดเจน ถ้าได้รับ Alert แล้วไม่ต้องทำอะไร ให้ลบทิ้ง 2) ตั้ง Threshold ให้เหมาะสม ไม่ Sensitive เกินไป 3) ใช้ Grouping และ Inhibition ลดจำนวน Alert 4) แบ่ง Severity ชัดเจน Critical ส่ง PagerDuty Warning ส่ง Slack Info ส่ง Email 5) ทำ Alert Review ทุกเดือน ลบ Alert ที่ไม่จำเป็น
Q: เริ่มต้น Monitoring ยังไงดีสำหรับทีมเล็ก?
A: เริ่มจาก Prometheus + Grafana + Alertmanager ตัวเดียว ใช้ Node Exporter Monitor Server ใส่ /metrics Endpoint ใน Application ตั้ง Alert สำหรับ 4 Golden Signals จากนั้นค่อยเพิ่ม Loki สำหรับ Logging เมื่อต้องการ ทั้งหมดนี้เป็น Open-source ไม่มีค่าใช้จ่ายด้านซอฟต์แวร์