Equity Technical Analysis — วิเคราะห์หุ้นด้วย

Equity Technical Analysis
Technical Analysis วิเคราะห์ทางเทคนิค ราคา Volume Chart Pattern Indicators Moving Average RSI MACD Bollinger Bands Candlestick หุ้น Forex Crypto
| Indicator | ประเภท | สัญญาณ | ใช้เมื่อ |
|---|---|---|---|
| SMA/EMA | Trend | Golden/Death Cross | ดู Trend Direction |
| RSI | Momentum | >70 Overbought <30 Oversold | หาจุดกลับตัว |
| MACD | Momentum | Signal Line Cross | ยืนยัน Trend |
| Bollinger | Volatility | Band Squeeze/Expansion | วัดความผันผวน |
| Stochastic | Momentum | >80 OB <20 OS | Sideways Market |
| Volume | Confirmation | Volume Spike | ยืนยันสัญญาณ |
Technical Indicators Python
# technical_analysis.py — Technical Indicators

from dataclasses import dataclass

from typing import List, Optional

import math


@dataclass

class OHLCV:

    date: str

    open: float

    high: float

    low: float

    close: float

    volume: int


def sma(prices: List[float], period: int) -> List[Optional[float]]:

    """Simple Moving Average"""

    result = []

    for i in range(len(prices)):

        if i < period - 1:

            result.append(None)

        else:

            avg = sum(prices[i-period+1:i+1]) / period

            result.append(round(avg, 2))

    return result


def ema(prices: List[float], period: int) -> List[Optional[float]]:

    """Exponential Moving Average"""

    result = []

    multiplier = 2 / (period + 1)

    for i in range(len(prices)):

        if i < period - 1:

            result.append(None)

        elif i == period - 1:

            avg = sum(prices[:period]) / period

            result.append(round(avg, 2))

        else:

            prev = result[-1]

            val = (prices[i] - prev) * multiplier + prev

            result.append(round(val, 2))

    return result


def rsi(prices: List[float], period: int = 14) -> List[Optional[float]]:

    """Relative Strength Index"""

    result = [None] * period

    gains = []

    losses = []

    for i in range(1, len(prices)):

        change = prices[i] - prices[i-1]

        gains.append(max(change, 0))

        losses.append(max(-change, 0))


    if len(gains) < period:

        return [None] * len(prices)


    avg_gain = sum(gains[:period]) / period

    avg_loss = sum(losses[:period]) / period


    if avg_loss == 0:

        result.append(100)

    else:

        rs = avg_gain / avg_loss

        result.append(round(100 - (100 / (1 + rs)), 2))


    for i in range(period, len(gains)):

        avg_gain = (avg_gain * (period - 1) + gains[i]) / period

        avg_loss = (avg_loss * (period - 1) + losses[i]) / period

        if avg_loss == 0:

            result.append(100)

        else:

            rs = avg_gain / avg_loss

            result.append(round(100 - (100 / (1 + rs)), 2))

    return result


# ตัวอย่างข้อมูล

data = [

    OHLCV("2024-01-01", 100, 105, 98, 103, 1500000),

    OHLCV("2024-01-02", 103, 108, 101, 107, 1800000),

    OHLCV("2024-01-03", 107, 112, 105, 110, 2000000),

    OHLCV("2024-01-04", 110, 115, 108, 113, 1700000),

    OHLCV("2024-01-05", 113, 118, 111, 116, 2200000),

    OHLCV("2024-01-06", 116, 120, 114, 118, 1900000),

    OHLCV("2024-01-07", 118, 121, 115, 117, 1600000),

    OHLCV("2024-01-08", 117, 119, 112, 114, 2100000),

    OHLCV("2024-01-09", 114, 116, 110, 112, 1800000),

    OHLCV("2024-01-10", 112, 115, 109, 113, 1500000),

]


closes = [d.close for d in data]

sma5 = sma(closes, 5)

ema5 = ema(closes, 5)


print("=== Technical Analysis ===")

print(f"{'Date':<12} {'Close':>6} {'SMA5':>6} {'EMA5':>6}")

for i, d in enumerate(data):

    s = f"{sma5[i]}" if sma5[i] else "-"

    e = f"{ema5[i]}" if ema5[i] else "-"

    print(f"  {d.date:<12} {d.close:>6.1f} {s:>6} {e:>6}")
MACD และ Trading Signal
# macd.py — MACD & Trading Signals

def calc_macd(prices: List[float], fast: int = 12, slow: int = 26,

              signal: int = 9):

    """MACD (Moving Average Convergence Divergence)"""

    ema_fast = ema(prices, fast)

    ema_slow = ema(prices, slow)


    macd_line = []

    for i in range(len(prices)):

        if ema_fast[i] is not None and ema_slow[i] is not None:

            macd_line.append(round(ema_fast[i] - ema_slow[i], 2))

        else:

            macd_line.append(None)


    valid_macd = [m for m in macd_line if m is not None]

    signal_line = ema(valid_macd, signal)


    return macd_line, signal_line


# Trading Strategy

from dataclasses import dataclass


@dataclass

class Signal:

    date: str

    type: str  # BUY / SELL

    price: float

    indicator: str

    strength: str  # strong / moderate / weak


def generate_signals(data: List[OHLCV]) -> List[Signal]:

    signals = []

    closes = [d.close for d in data]

    rsi_values = rsi(closes, 5)  # ใช้ period 5 สำหรับ demo

    sma_short = sma(closes, 3)

    sma_long = sma(closes, 5)


    for i in range(1, len(data)):

        # RSI Signal

        if rsi_values[i] is not None:

            if rsi_values[i] < 30:

                signals.append(Signal(data[i].date, "BUY", data[i].close,

                                      "RSI Oversold", "strong"))

            elif rsi_values[i] > 70:

                signals.append(Signal(data[i].date, "SELL", data[i].close,

                                      "RSI Overbought", "strong"))


        # MA Crossover

        if (sma_short[i] is not None and sma_long[i] is not None and

            sma_short[i-1] is not None and sma_long[i-1] is not None):

            if sma_short[i-1] < sma_long[i-1] and sma_short[i] > sma_long[i]:

                signals.append(Signal(data[i].date, "BUY", data[i].close,

                                      "Golden Cross", "moderate"))

            elif sma_short[i-1] > sma_long[i-1] and sma_short[i] < sma_long[i]:

                signals.append(Signal(data[i].date, "SELL", data[i].close,

                                      "Death Cross", "moderate"))


    return signals


signals = generate_signals(data)

print("\n=== Trading Signals ===")

for s in signals:

    print(f"  [{s.type}] {s.date} @ {s.price} — {s.indicator} ({s.strength})")


# Candlestick Patterns

patterns = {

    "Hammer": {"type": "Bullish Reversal", "desc": "ร่างเล็ก ไส้ล่างยาว 2x ท้าย Downtrend"},

    "Shooting Star": {"type": "Bearish Reversal", "desc": "ร่างเล็ก ไส้บนยาว 2x ท้าย Uptrend"},

    "Engulfing": {"type": "Reversal", "desc": "แท่งที่ 2 กลืนแท่งที่ 1 ทั้งหมด"},

    "Doji": {"type": "Indecision", "desc": "Open = Close ตลาดลังเล"},

    "Morning Star": {"type": "Bullish Reversal", "desc": "3 แท่ง ลง-เล็ก-ขึ้น ท้าย Downtrend"},

    "Evening Star": {"type": "Bearish Reversal", "desc": "3 แท่ง ขึ้น-เล็ก-ลง ท้าย Uptrend"},

}


print(f"\n\n=== Candlestick Patterns ===")

for name, info in patterns.items():

    print(f"  [{name}] {info['type']}")

    print(f"    {info['desc']}")
Backtesting
# backtest.py — Simple Backtesting

@dataclass

class Trade:

    entry_date: str

    entry_price: float

    exit_date: str

    exit_price: float

    direction: str

    pnl: float

    pnl_pct: float


@dataclass

class BacktestResult:

    trades: List[Trade]

    total_trades: int

    winners: int

    losers: int

    win_rate: float

    total_pnl: float

    max_drawdown: float


def simple_backtest(data: List[OHLCV], initial_capital: float = 100000):

    trades = []

    position = None

    capital = initial_capital

    peak = initial_capital

    max_dd = 0


    closes = [d.close for d in data]

    sma_s = sma(closes, 3)

    sma_l = sma(closes, 5)


    for i in range(1, len(data)):

        if sma_s[i] is None or sma_l[i] is None:

            continue

        if sma_s[i-1] is None or sma_l[i-1] is None:

            continue


        # Buy Signal

        if position is None and sma_s[i-1] < sma_l[i-1] and sma_s[i] > sma_l[i]:

            position = {"date": data[i].date, "price": data[i].close}


        # Sell Signal

        elif position and sma_s[i-1] > sma_l[i-1] and sma_s[i] < sma_l[i]:

            pnl = data[i].close - position["price"]

            pnl_pct = (pnl / position["price"]) * 100

            trades.append(Trade(

                position["date"], position["price"],

                data[i].date, data[i].close,

                "LONG", round(pnl, 2), round(pnl_pct, 2)))

            capital += pnl * (capital / position["price"])

            position = None


        peak = max(peak, capital)

        dd = (peak - capital) / peak * 100

        max_dd = max(max_dd, dd)


    winners = [t for t in trades if t.pnl > 0]

    losers = [t for t in trades if t.pnl <= 0]

    win_rate = len(winners) / len(trades) * 100 if trades else 0


    return BacktestResult(

        trades=trades,

        total_trades=len(trades),

        winners=len(winners),

        losers=len(losers),

        win_rate=round(win_rate, 1),

        total_pnl=round(sum(t.pnl for t in trades), 2),

        max_drawdown=round(max_dd, 2),

    )


result = simple_backtest(data)

print("=== Backtest Results ===")

print(f"  Total Trades: {result.total_trades}")

print(f"  Win Rate: {result.win_rate}%")

print(f"  Total PnL: {result.total_pnl}")

print(f"  Max Drawdown: {result.max_drawdown}%")


for t in result.trades:

    status = "WIN" if t.pnl > 0 else "LOSS"

    print(f"  [{status}] {t.entry_date} @ {t.entry_price} -> "

          f"{t.exit_date} @ {t.exit_price} = {t.pnl_pct:+.1f}%")
เคล็ดลับ
- Confluence: ใช้ 2-3 Indicators ยืนยันกัน ไม่ใช้ตัวเดียว
- Risk: ไม่เกิน 1-2% ต่อ Trade ตั้ง Stop Loss ทุกครั้ง
- Timeframe: ใช้ Timeframe สูงยืนยัน Timeframe ต่ำ
- Journal: จด Trading Journal ทบทวนทุกสัปดาห์
- Backtest: ทดสอบ Strategy กับข้อมูลย้อนหลังก่อนใช้เงินจริง
การนำความรู้ไปประยุกต์ใช้งานจริง

แหล่งเรียนรู้ที่แนะนำ ได้แก่ Official Documentation ที่อัพเดทล่าสุดเสมอ Online Course จาก Coursera Udemy edX ช่อง YouTube คุณภาพทั้งไทยและอังกฤษ และ Community อย่าง Discord Reddit Stack Overflow ที่ช่วยแลกเปลี่ยนประสบการณ์กับนักพัฒนาทั่วโลก
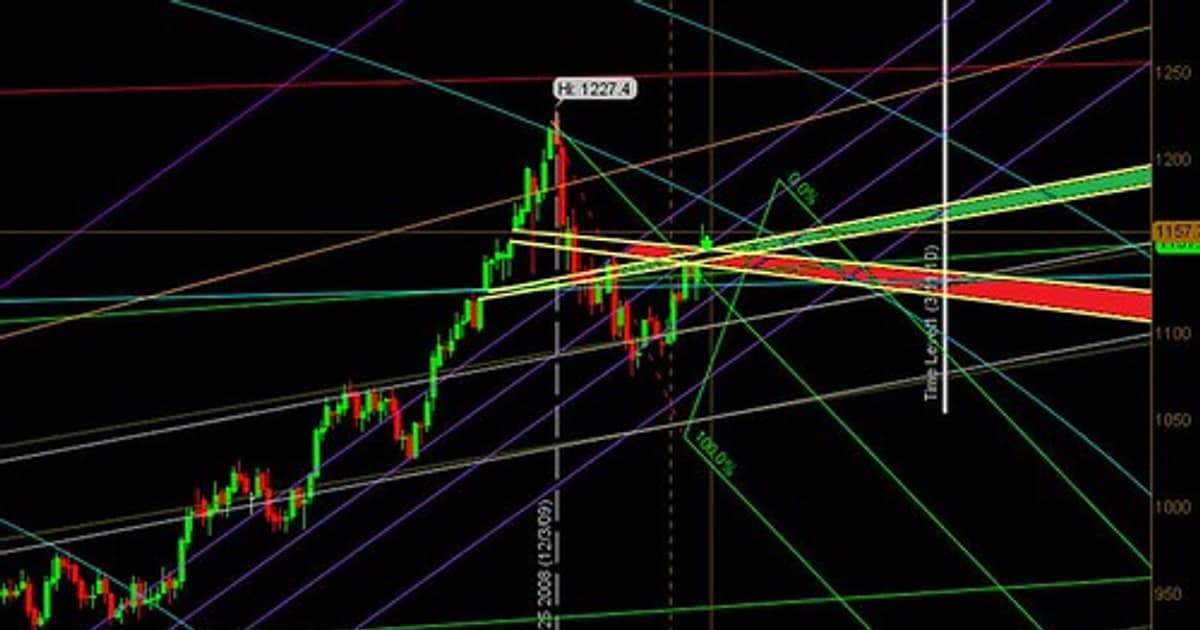
เนื้อหาเกี่ยวข้อง — อ่านต่อ: กราฟ Day Trade — ข้อมูลครบถ้วน 2026
เปรียบเทียบข้อดีและข้อเสีย
จากตารางเปรียบเทียบจะเห็นว่าข้อดีมีมากกว่าข้อเสียอย่างชัดเจน โดยเฉพาะในแง่ของประสิทธิภาพและความสามารถในการ Scale สำหรับข้อเสียส่วนใหญ่สามารถแก้ไขได้ด้วยการเรียนรู้อย่างเป็นระบบและวางแผนทรัพยากรให้เหมาะสม
Technical Analysis คืออะไร
วิเคราะห์ราคา Volume Chart Pattern Indicators คาดการณ์ทิศทาง ราคาสะท้อนข้อมูลทั้งหมด หุ้น Forex Crypto ทุกตลาด
แนะนำเพิ่มเติม — XM Signal
เนื้อหาเกี่ยวข้อง — แนะนำให้อ่าน Crowdsec IPS Machine Learning Pipeline
Indicator ที่นิยมมีอะไรบ้าง
Moving Average Trend RSI Momentum MACD Signal Bollinger Bands Volatility Stochastic Volume Fibonacci Retracement แนวรับต้าน
Candlestick Pattern สำคัญมีอะไร
Hammer Morning Star Engulfing Bullish Shooting Star Evening Star Bearish Doji Indecision Reversal Continuation Pattern
แนะนำเพิ่มเติม — คอร์สเทรด Forex ที่ iCafeForex
เนื้อหาเกี่ยวข้อง — ทำความเข้าใจ day trade หนังสือ — ข้อมูลครบถ้วน 2026
เริ่มต้นเทรดหุ้นควรทำอย่างไร
เรียน Chart Candlestick Indicator 2-3 ตัว Paper Trading Risk 1-2% เงินน้อย Trading Journal ทบทวน อย่าใช้อารมณ์
สรุป
Technical Analysis วิเคราะห์ทางเทคนิค Moving Average RSI MACD Bollinger Bands Candlestick Pattern Golden Cross Death Cross Backtest Risk Management Trading Journal
เนื้อหาเกี่ยวข้อง — ดูเพิ่มเติมเรื่อง Inducement คืออะไร — แนวคิด Smart Money ที่ต้องรู้
ทดลองเทรดฟรี XM — โบรกที่ อ.บอม ใช้เทรดจริง (พาร์ทเนอร์ XM)