แพทเทิร์น Head and Shoulders — วิเคราะห์ Chart
Head and Shoulders Pattern คืออะไร

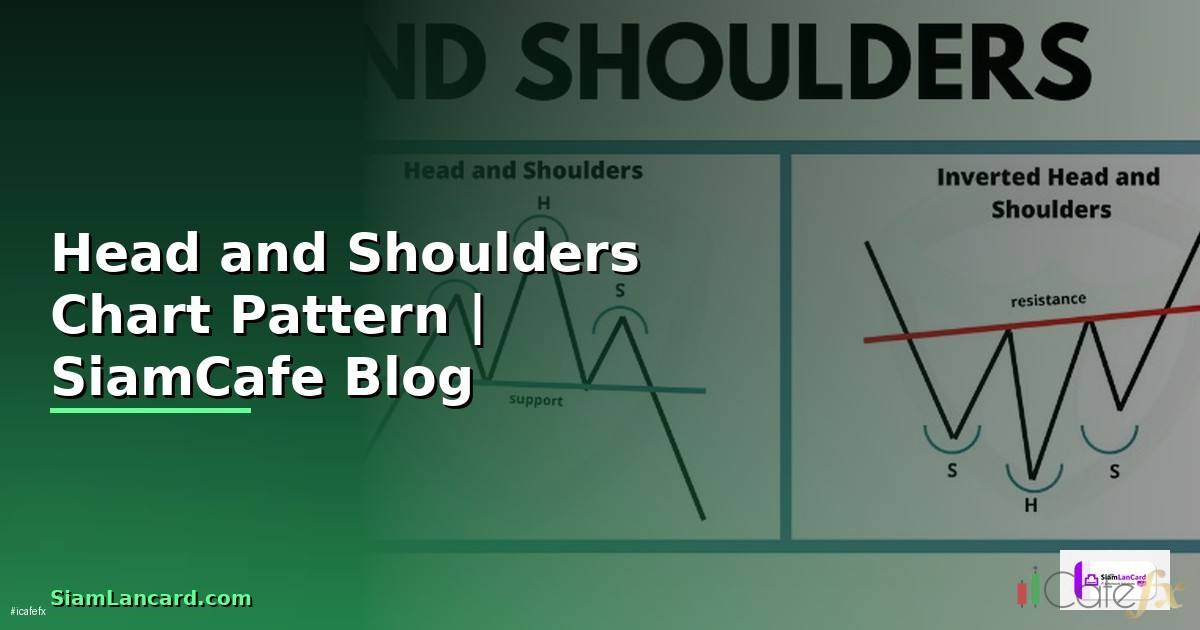
Head and Shoulders เป็น chart pattern ที่บ่งบอกถึงการกลับตัวของแนวโน้ม (trend reversal) จัดเป็นหนึ่งใน pattern ที่น่าเชื่อถือมากที่สุดใน Technical Analysis ประกอบด้วย 3 ยอดคือ Left Shoulder ที่เป็นยอดแรก Head ที่เป็นยอดสูงสุดตรงกลาง และ Right Shoulder ที่เป็นยอดสุดท้ายอยู่ระดับเดียวกับ Left Shoulder
Neckline คือเส้นที่ลากผ่านจุดต่ำสุดระหว่าง Left Shoulder กับ Head และจุดต่ำสุดระหว่าง Head กับ Right Shoulder เมื่อราคาทะลุ neckline ลงมาถือว่า pattern สมบูรณ์และเป็นสัญญาณขาย
Head and Shoulders แบ่งเป็น 2 ประเภทคือ Head and Shoulders Top ที่เกิดหลังขาขึ้นและบ่งบอกว่าราคาจะกลับตัวลง และ Inverse Head and Shoulders (Head and Shoulders Bottom) ที่เกิดหลังขาลงและบ่งบอกว่าราคาจะกลับตัวขึ้น
ปริมาณการซื้อขาย (Volume) มีบทบาทสำคัญในการยืนยัน pattern โดยทั่วไป volume จะสูงที่ Left Shoulder ลดลงที่ Head และลดลงอีกที่ Right Shoulder เมื่อราคาทะลุ neckline volume ควรเพิ่มขึ้นอย่างมากเพื่อยืนยันการ breakout
วิธีระบุ Head and Shoulders บน Chart
ขั้นตอนการระบุ Head and Shoulders Pattern อย่างเป็นระบบ
ขั้นตอนระบุ Head and Shoulders Top Pattern
1. ระบุ Uptrend ก่อนหน้า
- ราคาต้องอยู่ในขาขึ้นก่อนจะเกิด pattern
- ถ้าไม่มี uptrend ก่อนหน้า ไม่ใช่ H&S
2. ระบุ Left Shoulder
- ราคาขึ้นไปถึงจุดสูงสุดแล้วย่อตัวลง
- Volume สูง
3. ระบุ Head
- ราคาขึ้นไปสูงกว่า Left Shoulder
- แล้วย่อตัวลงมาใกล้ระดับเดียวกับจุดต่ำสุดของ Left Shoulder
- Volume อาจเท่าหรือน้อยกว่า Left Shoulder
4. ระบุ Right Shoulder
- ราคาขึ้นไปอีกครั้งแต่ไม่ถึงระดับ Head
- ควรอยู่ระดับใกล้เคียงกับ Left Shoulder
- Volume ลดลงอย่างชัดเจน (สำคัญมาก)
5. วาด Neckline
- ลากเส้นจากจุดต่ำสุดระหว่าง LS-Head ถึง Head-RS
- Neckline อาจเอียงขึ้นหรือลงเล็กน้อย
- Neckline แนวนอนถือว่าน่าเชื่อถือกว่า
6. รอ Breakout
- ราคาทะลุ neckline ลงมาพร้อม volume สูง
- อาจมี pullback มาทดสอบ neckline แล้วลงต่อ
7. คำนวณ Target Price
- Distance = Head Price - Neckline Price
- Target = Neckline Price - Distance
- เรียกว่า "Measured Move"
ตัวอย่าง:
Left Shoulder: $150
Head: $165
Right Shoulder: $152
เนื้อหาเกี่ยวข้อง — อ่านต่อ: MQL5 Reference — คู่มือเทรด Forex ฉบับสมบูรณ์
Neckline: $140
Distance: $165 - $140 = $25
Target: $140 - $25 = $115
เกณฑ์ประเมินคุณภาพ H&S Pattern:
- Symmetry: RS ใกล้เคียง LS (ดี)
- Volume: ลดลงจาก LS → Head → RS
- Neckline: แนวนอนหรือเอียงลงเล็กน้อย
- Breakout Volume: สูงกว่าค่าเฉลี่ย
- Prior Trend: มี uptrend ชัดเจน
- RS สูงกว่า Head: ไม่ใช่ H&S
- Volume เพิ่มขึ้นที่ RS: สัญญาณอ่อน
Inverse Head and Shoulders สำหรับขาขึ้น
Inverse Head and Shoulders เป็น bullish reversal pattern ที่เกิดหลังขาลง
Inverse Head and Shoulders (H&S Bottom)
แนะนำเพิ่มเติม — iCafeForex
โครงสร้าง:
Neckline
___/ \___
/  \    /  \    /  \
/    \  / Head\  /    \
\/ \/
Left Right
Shoulder Shoulder
ขั้นตอน:
1. ระบุ Downtrend ก่อนหน้า
2. Left Shoulder: ราคาลงไปถึงจุดต่ำสุดแล้วเด้งกลับขึ้น
3. Head: ราคาลงไปต่ำกว่า Left Shoulder แล้วเด้งกลับ
เนื้อหาเกี่ยวข้อง — บทความที่เกี่ยวข้อง: ราคาคริปโต — คู่มือฉบับสมบูรณ์ 2026
4. Right Shoulder: ราคาลงอีกครั้งแต่ไม่ต่ำเท่า Head
5. Neckline: ลากจากจุดสูงสุดระหว่าง LS-Head ถึง Head-RS
6. Breakout: ราคาทะลุ neckline ขึ้นไปพร้อม volume สูง
Volume Profile:
- Left Shoulder: volume สูง
- Head: volume ลดลง
- Right Shoulder: volume เริ่มเพิ่มขึ้น (ต่างจาก H&S Top)
- Breakout: volume สูงมาก (สำคัญมากสำหรับ bullish breakout)
ตัวอย่าง:

Left Shoulder: $80
Head: $65
Right Shoulder: $78
Neckline: $95
Distance: $95 - $65 = $30
Target: $95 + $30 = $125
แนะนำเพิ่มเติม — อ่านเพิ่มเติมที่ SiamCafeBook
Complex Head and Shoulders
บางครั้งอาจเจอ pattern ที่ซับซ้อนกว่า:
- Double Left Shoulder
- Double Right Shoulder
- Tilted Neckline (เอียงขึ้นหรือลง)
- Extended Right Shoulder
ยังคงใช้หลักการเดียวกันแต่ต้องยืดหยุ่นในการวิเคราะห์
ตรวจจับ Pattern อัตโนมัติด้วย Python
สร้างระบบตรวจจับ Head and Shoulders Pattern อัตโนมัติ
กลยุทธ์การเทรดด้วย Head and Shoulders
ขั้นตอนการเทรดด้วย H&S Pattern อย่างมีระบบ
กลยุทธ์การเทรด Head and Shoulders
=== Entry Strategies ===
เนื้อหาเกี่ยวข้อง — ฝันว่าฟันบนหลุด 2 ซี่ —
1. Breakout Entry (ปลอดภัยที่สุด)
- รอราคาทะลุ neckline แล้วเข้า sell/buy ทันที
- ข้อดี: ยืนยันแล้วว่า pattern สมบูรณ์
- ข้อเสีย: อาจพลาดส่วนหนึ่งของ move
2. Pullback Entry (ดีที่สุดสำหรับ Risk:Reward)
- รอราคา pullback กลับมาทดสอบ neckline
- เข้าเมื่อราคาเด้งจาก neckline
- ข้อดี: entry ดีกว่า, stop loss แคบกว่า
- ข้อเสีย: อาจไม่มี pullback
3. Aggressive Entry (ความเสี่ยงสูง)
- เข้าเมื่อ right shoulder กำลังก่อตัว
- ข้อดี: entry เร็วมาก, RR สูง
- ข้อเสีย: pattern อาจไม่สมบูรณ์
=== Stop Loss Placement ===
H&S Top:
- Above right shoulder (ปลอดภัย)
- Above neckline + ATR (แน่น)
Inverse H&S:
- Below right shoulder (ปลอดภัย)
- Below neckline - ATR (แน่น)
=== Take Profit ===
Target 1: Measured Move (distance from head to neckline)
Target 2: 1.618x Measured Move (Fibonacci extension)
Target 3: Next support/resistance level
Position Sizing
Risk per trade: 1-2% of account
Position size = (Account * Risk%) / (Entry - Stop Loss)
ตัวอย่าง H&S Top:
Account: $100,000
Risk: 1% = $1,000
Entry (short): $140 (neckline break)
Stop Loss: $153 (above right shoulder)
เนื้อหาเกี่ยวข้อง — ดูเพิ่มเติมเรื่อง financial freedom grant sabatier pdf download
Risk per share: $153 - $140 = $13
Position size: $1,000 / $13 = 76 shares
Target: $115 (measured move)
Reward: ($140 - $115) * 76 = $1,900
Risk:Reward = 1:1.9
Backtesting และวัดผล Pattern
ทดสอบประสิทธิภาพของ H&S Pattern ด้วยข้อมูลจริง
FAQ คำถามที่พบบ่อย
Q: Head and Shoulders มี success rate เท่าไหร่?
A: จากการศึกษาของ Thomas Bulkowski ใน Encyclopedia of Chart Patterns พบว่า H&S Top มี success rate ประมาณ 83% สำหรับการกลับตัวลง และ Inverse H&S มี success rate ประมาณ 89% สำหรับการกลับตัวขึ้น ตัวเลขนี้วัดจากราคาที่ทะลุ neckline แล้วเคลื่อนที่ไปในทิศทางที่คาดไว้
Q: Neckline ต้องเป็นเส้นตรงแนวนอนเท่านั้นไหม?
A: ไม่จำเป็น Neckline อาจเอียงขึ้นหรือลงได้ สำหรับ H&S Top neckline ที่เอียงลงมักให้ผลลัพธ์ดีกว่าเพราะแสดงว่าแนวโน้มอ่อนตัวแล้ว ส่วน neckline ที่เอียงขึ้นมากอาจลดความน่าเชื่อถือของ pattern ลง สิ่งสำคัญคือ neckline ต้องเชื่อมจุดต่ำสุด 2 จุดได้ชัดเจน
Q: ใช้ timeframe ไหนสำหรับ Head and Shoulders?
A: H&S ใน timeframe สูงเช่น Daily หรือ Weekly มีความน่าเชื่อถือมากที่สุดเพราะมี volume สนับสนุนมากกว่า timeframe ต่ำเช่น 15M หรือ 1H สามารถใช้ได้แต่มี false signal มากกว่า สำหรับ swing trading แนะนำ Daily chart สำหรับ position trading ใช้ Weekly chart
Q: ถ้า Right Shoulder สูงกว่า Left Shoulder ยังเป็น H&S ไหม?
A: ยังเป็นได้แต่ pattern จะอ่อนกว่า Right Shoulder ที่สูงกว่า Left Shoulder แสดงว่าแรงซื้อยังไม่หมด pattern อาจล้มเหลว ในทางตรงกันข้าม Right Shoulder ที่ต่ำกว่า Left Shoulder แสดงว่าแรงซื้ออ่อนลงชัดเจนและ pattern มีโอกาสสำเร็จมากกว่า
เริ่มต้นเทรด Forex กับ XM — โบรกที่ อ.บอม ใช้เทรดจริง (พาร์ทเนอร์ XM)