WordPress Block Theme กับ Log Management ELK —
WordPress Block Theme คืออะไร
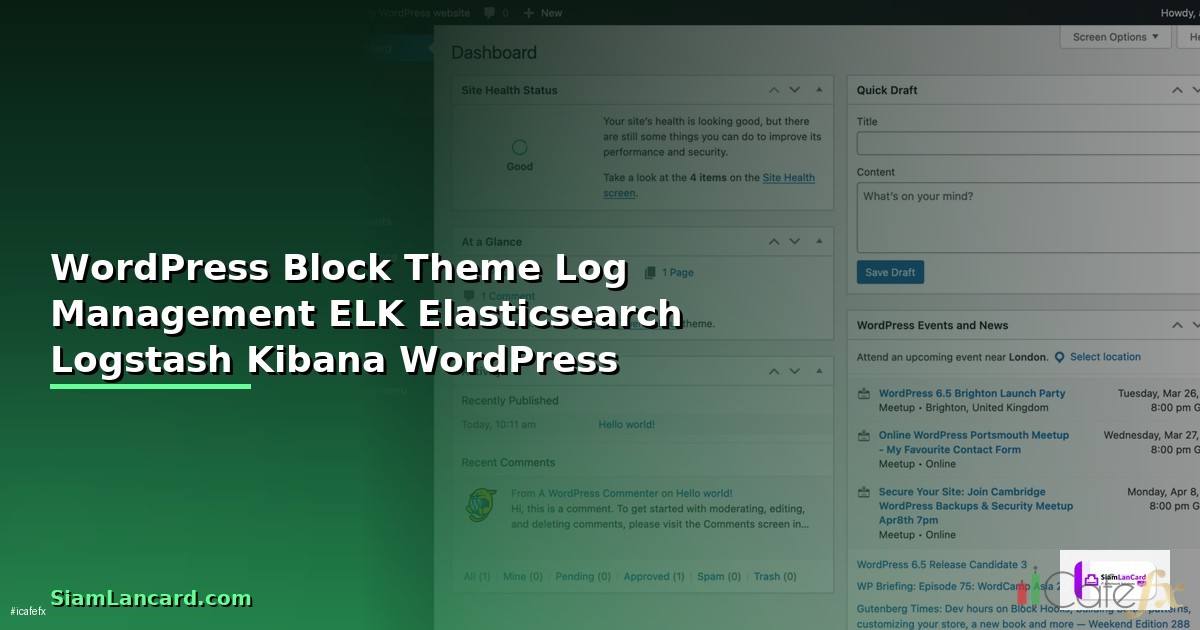
WordPress Block Theme เป็นวิวัฒนาการใหม่ของระบบ Theme ที่ใช้ Full Site Editing (FSE) ทั้งหมด แทนที่จะเขียน PHP Template Files อย่าง header.php, footer.php, single.php ตอนนี้ใช้ HTML Files ที่ประกอบด้วย Block Markup ในโฟลเดอร์ templates/ และ parts/ ร่วมกับ theme.json สำหรับกำหนด Style, Colors, Typography และ Layout Settings
เมื่อ WordPress Site มีขนาดใหญ่ขึ้นและมี Traffic สูง การจัดการ Log อย่างเป็นระบบกลายเป็นสิ่งจำเป็น ELK Stack (Elasticsearch, Logstash, Kibana) เป็นโซลูชันมาตรฐานสำหรับ Centralized Log Management ที่ช่วยรวบรวม วิเคราะห์ และ Visualize Log จาก WordPress Server ทั้งหมดในที่เดียว
เนื้อหาเกี่ยวข้อง — ทำความเข้าใจ Lit Element Post-mortem Analysis — วิธีตั้งค่าและใช้งานจริงพร้อมตัวอย่าง
โครงสร้าง WordPress Block Theme
# โครงสร้าง Block Theme
my-block-theme/
├── style.css # Theme Metadata
├── theme.json # Global Styles & Settings
├── templates/ # Full Page Templates
│ ├── index.html
│ ├── single.html
│ ├── page.html
│ ├── archive.html
│ ├── 404.html
│ └── search.html
├── parts/ # Reusable Template Parts
│ ├── header.html
│ ├── footer.html
│ └── sidebar.html
├── patterns/ # Block Patterns
│ ├── hero.php
│ └── cta.php
└── assets/
 ├── fonts/
 └── images/

---
# theme.json — Global Configuration
{
 "$schema": "https://schemas.wp.org/wp/6.5/theme.json",
 "version": 2,
 "settings": {
 "appearanceTools": true,
 "color": {
 "palette": [
 {"slug": "primary", "color": "#1e40af", "name": "Primary"},
 {"slug": "secondary", "color": "#7c3aed", "name": "Secondary"},
 {"slug": "accent", "color": "var(--c-primary)", "name": "Accent"},
 {"slug": "dark", "color": "#0f172a", "name": "Dark"},
 {"slug": "light", "color": "#f8fafc", "name": "Light"}
 ],
 "gradients": [
 {
 "slug": "primary-to-secondary",
 "gradient": "linear-gradient(135deg, #1e40af, #7c3aed)",
 "name": "Primary to Secondary"
 }
 ]
 },
 "typography": {
 "fontFamilies": [
 {
 "fontFamily": "'Inter', sans-serif",
 "slug": "inter",
 "name": "Inter",
 "fontFace": [
 {"fontFamily": "Inter", "fontWeight": "400", "fontStyle": "normal",
 "src": ["file:./assets/fonts/inter-regular.woff2"]},
 {"fontFamily": "Inter", "fontWeight": "700", "fontStyle": "normal",
 "src": ["file:./assets/fonts/inter-bold.woff2"]}
 ]
 }
 ],
 "fontSizes": [
 {"slug": "small", "size": "0.875rem", "name": "Small"},
 {"slug": "medium", "size": "1rem", "name": "Medium"},
 {"slug": "large", "size": "1.25rem", "name": "Large"},
 {"slug": "x-large", "size": "2rem", "name": "Extra Large"}
 ]
 },
 "layout": {
 "contentSize": "720px",
 "wideSize": "1200px"
 }
 },
 "styles": {
 "color": {
 "background": "var(--wp--preset--color--light)",
 "text": "var(--wp--preset--color--dark)"
 },
 "typography": {
 "fontFamily": "var(--wp--preset--font-family--inter)",
 "fontSize": "var(--wp--preset--font-size--medium)",
 "lineHeight": "1.7"
 },
 "elements": {
 "link": {
 "color": {"text": "var(--wp--preset--color--primary)"},
 ":hover": {"color": {"text": "var(--wp--preset--color--secondary)"}}
 },
 "h1": {"typography": {"fontSize": "2.5rem", "fontWeight": "700"}},
 "h2": {"typography": {"fontSize": "2rem", "fontWeight": "700"}}
 }
 }
}
การตั้งค่า ELK Stack สำหรับ WordPress
# docker-compose.yml — ELK Stack สำหรับ WordPress Log Management
version: "3.8"

services:
 elasticsearch:
 image: docker.elastic.co/elasticsearch/elasticsearch:8.12.0
 environment:
 - discovery.type=single-node
 - xpack.security.enabled=true
 - ELASTIC_PASSWORD=
 - "ES_JAVA_OPTS=-Xms2g -Xmx2g"
 volumes:
 - es_data:/usr/share/elasticsearch/data
 ports:
 - "9200:9200"
 healthcheck:
 test: ["CMD-SHELL", "curl -s -u elastic: http://localhost:9200/_cluster/health | grep -q 'green\\|yellow'"]
 interval: 30s
 timeout: 10s
 retries: 5

 logstash:
 image: docker.elastic.co/logstash/logstash:8.12.0
 volumes:
 - ./logstash/pipeline:/usr/share/logstash/pipeline
 - ./logstash/config:/usr/share/logstash/config
 ports:
 - "5044:5044"
 environment:
 - "LS_JAVA_OPTS=-Xms1g -Xmx1g"
 depends_on:
 elasticsearch:
 condition: service_healthy

 kibana:
 image: docker.elastic.co/kibana/kibana:8.12.0
 environment:
 - ELASTICSEARCH_HOSTS=http://elasticsearch:9200
 - ELASTICSEARCH_USERNAME=kibana_system
 - ELASTICSEARCH_PASSWORD=
 ports:
 - "5601:5601"
 depends_on:
 elasticsearch:
 condition: service_healthy

volumes:
 es_data:

---
# logstash/pipeline/wordpress.conf
input {
 beats {
 port => 5044
 }
}

filter {
 # Parse Nginx Access Log
 if [fields][log_type] == "nginx_access" {
 grok {
 match => { "message" => '%{IPORHOST:client_ip} - %{DATA:user} \[%{HTTPDATE:timestamp}\] "%{WORD:method} %{URIPATHPARAM:request} HTTP/%{NUMBER:http_version}" %{NUMBER:status} %{NUMBER:bytes} "%{DATA:referrer}" "%{DATA:user_agent}"' }
 }
 date {
 match => [ "timestamp", "dd/MMM/yyyy:HH:mm:ss Z" ]
 }
 geoip {
 source => "client_ip"
 target => "geo"
 }
 useragent {
 source => "user_agent"
 target => "ua"
 }
 # ตรวจจับ WordPress Attack Patterns
 if [request] =~ /wp-login\.php/ {
 mutate { add_tag => ["login_attempt"] }
 }
 if [request] =~ /xmlrpc\.php/ {
 mutate { add_tag => ["xmlrpc_attempt"] }
 }
 if [request] =~ /wp-admin/ and [status] == "403" {
 mutate { add_tag => ["admin_blocked"] }
 }
 }

 # Parse PHP Error Log
 if [fields][log_type] == "php_error" {
 grok {
 match => { "message" => "\[%{DATA:timestamp}\] %{DATA:error_type}: %{GREEDYDATA:error_message}" }
 }
 if [error_type] == "Fatal error" {
 mutate { add_tag => ["critical"] }
 }
 }

 # Parse WordPress Debug Log
 if [fields][log_type] == "wp_debug" {
 grok {
 match => { "message" => "\[%{DATA:timestamp}\] PHP %{DATA:severity}: %{GREEDYDATA:debug_message} in %{DATA:file} on line %{NUMBER:line}" }
 }
 }
}

output {
 elasticsearch {
 hosts => ["http://elasticsearch:9200"]
 user => "elastic"
 password => ""
 index => "wordpress-%{[fields][log_type]}-%{+YYYY.MM.dd}"
 }
}

---
# Filebeat Configuration บน WordPress Server
# /etc/filebeat/filebeat.yml
filebeat.inputs:
 - type: log
 enabled: true
 paths:
 - /var/log/nginx/access.log
 fields:
 log_type: nginx_access
 fields_under_root: false

 - type: log
 enabled: true
 paths:
 - /var/log/nginx/error.log
 fields:
 log_type: nginx_error

 - type: log
 enabled: true
 paths:
 - /var/log/php8.2-fpm.log
 fields:
 log_type: php_error
 multiline:
 pattern: '^\['
 negate: true
 match: after

 - type: log
 enabled: true
 paths:
 - /var/www/html/wp-content/debug.log
 fields:
 log_type: wp_debug

output.logstash:
 hosts: ["elk-server:5044"]

# ติดตั้ง Filebeat
# curl -L -O https://artifacts.elastic.co/downloads/beats/filebeat/filebeat-8.12.0-amd64.deb
# sudo dpkg -i filebeat-8.12.0-amd64.deb
# sudo systemctl enable filebeat
# sudo systemctl start filebeat
Kibana Dashboard สำหรับ WordPress
# สร้าง Index Pattern ใน Kibana
# 1. ไปที่ Stack Management > Index Patterns
# 2. สร้าง Pattern: wordpress-*
# 3. เลือก @timestamp เป็น Time Filter

# Kibana Saved Search — Login Attempts
# GET wordpress-nginx_access-*/_search
{
 "query": {
 "bool": {
 "must": [
 {"match": {"request": "wp-login.php"}},
 {"match": {"method": "POST"}}
 ],
 "filter": [
 {"range": {"@timestamp": {"gte": "now-24h"}}}
 ]
 }
 },
 "aggs": {
 "by_ip": {
 "terms": {"field": "client_ip.keyword", "size": 20},
 "aggs": {
 "by_status": {
 "terms": {"field": "status.keyword"}
 }
 }
 },
 "by_country": {
 "terms": {"field": "geo.country_name.keyword", "size": 10}
 },
 "over_time": {
 "date_histogram": {
 "field": "@timestamp",
 "fixed_interval": "1h"
 }
 }
 }
}

# Alert Rule — Brute Force Detection
# ถ้ามี Login Attempt จาก IP เดียวกันมากกว่า 10 ครั้งใน 5 นาที
# Kibana > Alerts > Create Rule
# Rule type: Elasticsearch query
# Query: tags:login_attempt AND method:POST
# Group by: client_ip.keyword
# Threshold: > 10 in 5 minutes
# Action: Send to Slack/Email
Security Monitoring สำหรับ WordPress
- Brute Force Detection: ตรวจจับ Login Attempts ที่ผิดปกติจาก IP เดียวกัน มากกว่า 10 ครั้งใน 5 นาที
- XML-RPC Attack: ตรวจจับ Request ไปยัง xmlrpc.php ที่ผิดปกติ ควร Disable XML-RPC ถ้าไม่ได้ใช้
- File Upload Monitoring: ตรวจจับ Upload ไฟล์ .php ไปยัง wp-content/uploads/ ซึ่งอาจเป็น Webshell
- Plugin/Theme Changes: ตรวจจับการติดตั้ง/อัปเดต Plugin หรือ Theme ที่ไม่ได้รับอนุญาต
- 404 Scanning: ตรวจจับ Bot ที่ Scan หา Vulnerable Paths เช่น /wp-config.php.bak, /backup.sql
- Slow Query Detection: ตรวจจับ MySQL Query ที่ใช้เวลานานเกิน 1 วินาที อาจเป็น SQL Injection หรือ Query ที่ต้อง Optimize
WordPress Performance Log Analysis
WordPress Block Theme คืออะไร
Block Theme เป็นรูปแบบ Theme ใหม่ที่ใช้ Full Site Editing ทั้งหมด ออกแบบ Layout ด้วย Block Editor แทน PHP Template Files ใช้ theme.json กำหนด Style และ Settings ทำให้สร้าง Theme ได้ง่ายขึ้นโดยไม่ต้องเขียน PHP มากเหมือนก่อน
ELK Stack คืออะไรและใช้กับ WordPress ทำไม
ELK Stack คือ Elasticsearch (Search Engine), Logstash (Log Processing), Kibana (Visualization) ใช้กับ WordPress เพื่อรวบรวมและวิเคราะห์ Log ทุกประเภทจาก Server ช่วยตรวจจับ Security Threats เช่น Brute Force, วิเคราะห์ Performance และ Troubleshoot ปัญหาได้รวดเร็ว
แนะนำเพิ่มเติม — ติดตาม XM Signal
เนื้อหาเกี่ยวข้อง — เขียนโปรแกรม arduino
Filebeat คืออะไรและทำไมต้องใช้ร่วมกับ ELK
Filebeat เป็น Lightweight Log Shipper ติดตั้งบน WordPress Server เพื่อส่ง Log ไปยัง Logstash หรือ Elasticsearch ใช้ Resource น้อยกว่า Logstash (CPU ~1%, RAM ~50MB) เหมาะสำหรับ Server ที่มี Resource จำกัด รองรับ Multiline Log และ Back Pressure
เนื้อหาเกี่ยวข้อง — ดูเพิ่มเติมเรื่อง lấy hóa đơn điện tử tiền điện
ควรเก็บ Log อะไรบ้างสำหรับ WordPress
ควรเก็บ Nginx/Apache Access Log, Error Log, PHP Error Log (php-fpm), WordPress Debug Log (debug.log), Plugin Activity Log, Login Attempts Log, Database Slow Query Log และ WP-CLI Command Log เพื่อครอบคลุมทั้ง Performance, Security และ Troubleshooting
แนะนำเพิ่มเติม — iCafeForex
สรุปและแนวทางปฏิบัติ
WordPress Block Theme เป็นอนาคตของ WordPress Theme Development ที่ทำให้สร้างและจัดการ Theme ได้ง่ายขึ้น ส่วน ELK Stack เป็นโซลูชัน Log Management ที่จำเป็นสำหรับ WordPress Site ที่มี Traffic สูง การรวม Filebeat บน WordPress Server กับ ELK Stack ทำให้สามารถตรวจจับ Security Threats, วิเคราะห์ Performance Bottlenecks และ Troubleshoot ปัญหาได้อย่างรวดเร็ว ตั้ง Alert Rules สำหรับ Brute Force, XML-RPC Attack และ Suspicious File Uploads เพื่อตอบสนองต่อ Incident ได้ทันเวลา
เนื้อหาเกี่ยวข้อง — แนะนำให้อ่าน Container Security Trivy Site Reliability SRE