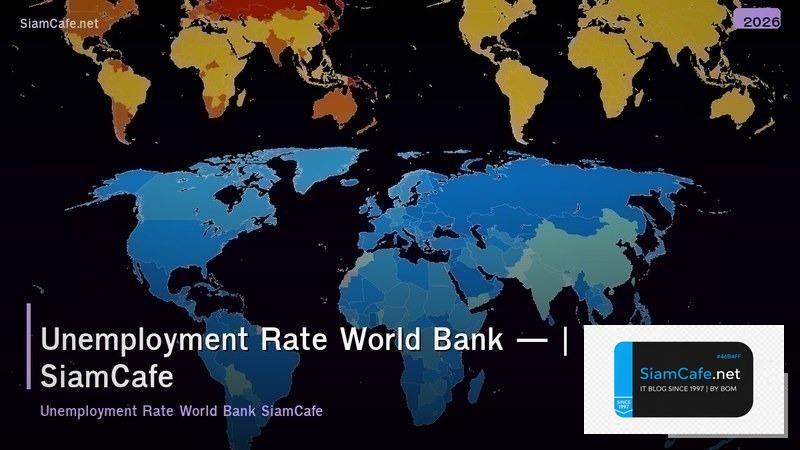
Unemployment Rate World Bank — อัตราการว่างงานจากธนาคารโลก
World Bank Unemployment Data

Unemployment Rate World Bank Open Data API ILO ASEAN Indicator SL.UEM.TOTL.ZS Analysis Dashboard Trend Comparison
| Indicator | Code | Description | Source |
|---|---|---|---|
| Unemployment Total | SL.UEM.TOTL.ZS | อัตราว่างงานรวม (% of labor force) | ILO |
| Youth Unemployment | SL.UEM.1524.ZS | อัตราว่างงานเยาวชน 15-24 ปี | ILO |
| Female Unemployment | SL.UEM.TOTL.FE.ZS | อัตราว่างงานหญิง | ILO |
| Male Unemployment | SL.UEM.TOTL.MA.ZS | อัตราว่างงานชาย | ILO |
| Long-term Unemployment | SL.UEM.LTRM.ZS | ว่างงานระยะยาว (>12 เดือน) | ILO |
Data Retrieval
# === World Bank API Data Retrieval ===

# pip install wbgapi pandas requests plotly

# import wbgapi as wb
# import pandas as pd
# import requests
#
# # Method 1: wbgapi Library (Recommended)
# df = wb.data.DataFrame(
# 'SL.UEM.TOTL.ZS',
# economy=['THA', 'SGP', 'MYS', 'IDN', 'PHL', 'VNM'],
# time=range(2000, 2024),
# labels=True
# )
# print(df)
#
# # Method 2: REST API
# url = "http://api.worldbank.org/v2/country/THA/indicator/SL.UEM.TOTL.ZS"
# params = {"format": "json", "date": "2000:2023", "per_page": 100}
# response = requests.get(url, params=params)
# data = response.json()[1]
# df = pd.DataFrame([{
# "year": d["date"],
# "country": d["country"]["value"],
# "unemployment": d["value"]
# } for d in data if d["value"] is not None])
#
# # Method 3: Multiple Indicators
# indicators = {
# 'SL.UEM.TOTL.ZS': 'Total Unemployment',
# 'SL.UEM.1524.ZS': 'Youth Unemployment',
# 'SL.UEM.TOTL.FE.ZS': 'Female Unemployment',
# 'NY.GDP.MKTP.KD.ZG': 'GDP Growth',
# }
# for code, name in indicators.items():
# df = wb.data.DataFrame(code, economy='THA', time=range(2010, 2024))
# print(f"{name}: {df.iloc[-1].values[0]:.1f}%")

from dataclasses import dataclass

@dataclass
class DataSource:
 method: str
 library: str
 ease: str
 features: str
 limitation: str

sources = [
 DataSource("wbgapi (Python)",
 "pip install wbgapi",
 "ง่ายมาก",
 "DataFrame ตรง Filter Country Year Indicator",
 "ข้อมูลรายปี Update ช้า (1-2 ปี Lag)"),
 DataSource("REST API",
 "requests",
 "ปานกลาง",
 "JSON XML รองรับทุกภาษา",
 "ต้อง Parse JSON เอง Pagination"),
 DataSource("pandas-datareader",
 "pip install pandas-datareader",
 "ง่าย",
 "Pandas Integration ดึงหลาย Indicator",
 "อาจ Deprecated บาง Source"),
 DataSource("WDI (R)",
 "install.packages('WDI')",
 "ง่าย (R users)",
 "R DataFrame ggplot2 Integration",
 "R only"),
 DataSource("CSV Download",
 "data.worldbank.org",
 "ง่ายมาก",
 "ไม่ต้อง Code Download ตรง",
 "Manual ไม่อัตโนมัติ"),
]

print("=== Data Sources ===")
for s in sources:
 print(f" [{s.method}] {s.library}")
 print(f" Ease: {s.ease} | Features: {s.features}")
 print(f" Limit: {s.limitation}")
Analysis
# === Unemployment Analysis ===

@dataclass
class CountryData:
 country: str
 code: str
 unemployment_2023: float
 youth_unemployment: float
 trend: str
 note: str

countries = [
 CountryData("Thailand", "THA", 1.0, 5.2,
 "คงที่ต่ำตลอด",
 "ต่ำที่สุดในโลก เพราะนับ Informal Sector"),
 CountryData("Singapore", "SGP", 2.1, 6.5,
 "คงที่",
 "Full Employment ใกล้เคียง Natural Rate"),
 CountryData("Malaysia", "MYS", 3.4, 11.8,
 "ลดจาก COVID",
 "Youth Unemployment สูง 3x Overall"),
 CountryData("Indonesia", "IDN", 3.5, 13.5,
 "ลดต่อเนื่อง",
 "ประชากรมาก Labor Market ใหญ่"),
 CountryData("Philippines", "PHL", 2.4, 6.8,
 "ลดจาก COVID Peak",
 "OFW ช่วยลด Unemployment"),
 CountryData("Vietnam", "VNM", 2.0, 7.2,
 "คงที่ต่ำ",
 "Manufacturing Growth ดูดซับแรงงาน"),
 CountryData("Japan", "JPN", 2.6, 4.1,
 "คงที่ต่ำ",
 "Aging Population แรงงานขาด"),
 CountryData("USA", "USA", 3.6, 8.5,
 "ลดจาก COVID",
 "Fed Monitor ใกล้ชิด"),
 CountryData("World", "WLD", 5.5, 13.2,
 "ลดช้า",
 "ค่าเฉลี่ยโลก Youth 2.4x Overall"),
]

print("=== ASEAN + World Unemployment ===")
for c in countries:
 gap = c.youth_unemployment - c.unemployment_2023
 print(f" [{c.country} ({c.code})]")
 print(f" Overall: {c.unemployment_2023}% | Youth: {c.youth_unemployment}% | Gap: +{gap:.1f}%")
 print(f" Trend: {c.trend} | Note: {c.note}")
Dashboard
# === Plotly Dashboard ===

# import plotly.express as px
# import plotly.graph_objects as go
# import wbgapi as wb
# import pandas as pd
#
# # World Map Choropleth
# df = wb.data.DataFrame('SL.UEM.TOTL.ZS', time=2022, labels=True)
# df = df.reset_index()
# fig = px.choropleth(
# df, locations='economy', locationmode='ISO-3',
# color='SL.UEM.TOTL.ZS',
# title='World Unemployment Rate 2022',
# color_continuous_scale='RdYlGn_r',
# range_color=[0, 30],
# )
# fig.show()
#
# # ASEAN Comparison Bar Chart
# asean = ['THA', 'SGP', 'MYS', 'IDN', 'PHL', 'VNM']
# df = wb.data.DataFrame('SL.UEM.TOTL.ZS', economy=asean, time=2022)
# fig = px.bar(df.reset_index(), x='economy', y='SL.UEM.TOTL.ZS',
# title='ASEAN Unemployment Rate 2022')
# fig.show()
#
# # Trend Line Chart
# df = wb.data.DataFrame('SL.UEM.TOTL.ZS', economy='THA',
# time=range(2000, 2024))
# fig = px.line(df.T.reset_index(), x='index', y='THA',
# title='Thailand Unemployment Trend')
# fig.show()

@dataclass
class DashboardPanel:
 panel: str
 chart_type: str
 data: str
 insight: str

panels = [
 DashboardPanel("World Map",
 "Choropleth Map",
 "ทุกประเทศ ปีล่าสุด",
 "เห็นภาพรวมโลก แอฟริกา ตะวันออกกลาง สูงสุด"),
 DashboardPanel("ASEAN Comparison",
 "Bar Chart",
 "ASEAN 10 ประเทศ",
 "ไทยต่ำสุด Youth Gap สูงทุกประเทศ"),
 DashboardPanel("Historical Trend",
 "Line Chart",
 "เลือกประเทศ 2000-2023",
 "ดูผลกระทบ COVID-19 2008 Crisis"),
 DashboardPanel("Youth vs Overall",
 "Grouped Bar",
 "เปรียบเทียบ Youth กับ Overall",
 "Youth สูงกว่า 2-3 เท่าทุกประเทศ"),
 DashboardPanel("Gender Gap",
 "Stacked Bar",
 "Male vs Female Unemployment",
 "ตะวันออกกลาง Female สูงมาก"),
 DashboardPanel("GDP Correlation",
 "Scatter Plot",
 "Unemployment vs GDP Growth",
 "GDP สูง = Unemployment ต่ำ (Negative Correlation)"),
]

print("=== Dashboard Panels ===")
for p in panels:
 print(f" [{p.panel}] {p.chart_type}")
 print(f" Data: {p.data}")
 print(f" Insight: {p.insight}")
เคล็ดลับ

- wbgapi: ใช้ wbgapi Library ดึงข้อมูลง่ายที่สุด
- Lag: ข้อมูล World Bank มี Lag 1-2 ปี ไม่ใช่ Real-time
- Youth: ดู Youth Unemployment ร่วมด้วยเสมอ สำคัญกว่า Overall
- Informal: บางประเทศนับ Informal Sector ทำให้ตัวเลขต่ำ
- Compare: เปรียบเทียบในกลุ่มเดียวกัน ASEAN OECD ไม่ข้ามกลุ่ม
World Bank Data คืออะไร
Open Data เศรษฐกิจสังคม 200+ ประเทศ 1960-ปัจจุบัน SL.UEM.TOTL.ZS ILO API CSV ฟรี Creative Commons Youth Female Male
เนื้อหาเกี่ยวข้อง — ทำความเข้าใจ Rust Tokio Code Review Best Practice
ดึงข้อมูลอย่างไร
wbgapi Python REST API JSON pandas-datareader WDI R CSV Download data.worldbank.org country indicator date format per_page
วิเคราะห์อย่างไร
เปรียบเทียบประเทศ ASEAN Youth Overall Gender GDP Correlation COVID-19 Trend Informal Sector ILO World Average 5.5%
แนะนำเพิ่มเติม — เรียนเทรดกับ iCafeForex
เนื้อหาเกี่ยวข้อง — อ่านต่อ: Btrfs Filesystem Citizen Developer
Dashboard ทำอย่างไร
Plotly Choropleth Line Bar Scatter Streamlit Grafana InfluxDB Tableau Power BI Google Data Studio Filter Country Year Indicator
เนื้อหาเกี่ยวข้อง — บทความที่เกี่ยวข้อง: Mintlify Docs DevOps Culture
สรุป
Unemployment Rate World Bank API wbgapi ASEAN Thailand ILO Youth Gender GDP Correlation COVID-19 Dashboard Plotly Analysis
แนะนำเพิ่มเติม — สัญญาณเทรดรายวัน XM Signal
อ่านเพิ่มเติม: สอนเทรด Forex | XM Signal | IT Hardware | อาชีพ IT | SiamCafe Book | iCafe Cloud
เนื้อหาเกี่ยวข้อง — บทความที่เกี่ยวข้อง: python data structure and algorithm