TensorRT Optimization Incident Management คืออะไร
TensorRT เป็น high-performance deep learning inference optimizer จาก NVIDIA ที่ช่วยเร่งความเร็ว AI models บน GPU ได้ 2-6 เท่า ผ่าน layer fusion, precision calibration (FP16/INT8) และ kernel auto-tuning Incident Management คือกระบวนการจัดการเหตุการณ์ผิดปกติใน production ตั้งแต่ detection จนถึง resolution การรวมสองแนวคิดช่วยจัดการปัญหาที่เกิดกับ TensorRT models ใน production เช่น inference latency spikes, accuracy degradation, OOM errors และ model serving failures
TensorRT Optimization Pipeline
# tensorrt_pipeline.py — TensorRT optimization pipeline
import json
class TensorRTPipeline:
STAGES = {
"model_export": {
"name": "1. Model Export",
"description": "Export model จาก PyTorch/TensorFlow เป็น ONNX format",
"tools": "torch.onnx.export(), tf2onnx, onnxruntime",
},
"optimization": {
"name": "2. TensorRT Optimization",
"description": "Convert ONNX → TensorRT engine ด้วย trtexec หรือ Python API",
"techniques": [
"Layer fusion — รวม operations เพื่อลด memory transfers",
"Precision calibration — FP32 → FP16/INT8 ลด memory + เพิ่มความเร็ว",
"Dynamic shapes — รองรับ variable batch sizes",
"Kernel auto-tuning — เลือก CUDA kernel ที่เร็วที่สุดสำหรับ GPU",
],
},
"validation": {
"name": "3. Accuracy Validation",
"description": "เปรียบเทียบ output ของ TensorRT engine กับ original model",
"metrics": "MSE, cosine similarity, Top-1/Top-5 accuracy",
},
"deployment": {
"name": "4. Deployment",
"description": "Deploy TensorRT engine ด้วย Triton Inference Server",
"tools": "Triton, TensorRT-LLM, custom FastAPI server",
},
"monitoring": {
"name": "5. Production Monitoring",
"description": "Monitor latency, throughput, accuracy, GPU utilization",
"tools": "Prometheus, Grafana, Triton metrics endpoint",
},
}
def show_pipeline(self):
print("=== TensorRT Pipeline ===\n")
for key, stage in self.STAGES.items():
print(f"[{stage['name']}]")
print(f" {stage['description']}")
if 'techniques' in stage:
for tech in stage['techniques'][:3]:
print(f" • {tech}")
print()
pipeline = TensorRTPipeline()
pipeline.show_pipeline()
Common Incidents & Root Causes
# incidents.py — Common TensorRT incidents
import json
class TensorRTIncidents:
INCIDENTS = {
"latency_spike": {
"name": "Inference Latency Spike",
"severity": "P1",
"symptoms": "P99 latency เพิ่มจาก 10ms → 200ms+",
"root_causes": [
"GPU memory fragmentation — ใช้ memory pool",
"Thermal throttling — GPU ร้อนเกิน → clock speed ลด",
"CUDA context switching — หลาย processes แย่ง GPU",
"Dynamic shape recompilation — input shape เปลี่ยน",
],
"resolution": "Restart inference server, fix memory pool, add GPU cooling",
},
"oom_error": {
"name": "GPU Out of Memory (OOM)",
"severity": "P1",
"symptoms": "CUDA out of memory error, inference fails",
"root_causes": [
"Batch size ใหญ่เกินไป",
"Memory leak ใน pre/post processing",
"Multiple models loaded พร้อมกัน",
"TensorRT workspace size ใหญ่เกิน",
],
"resolution": "Reduce batch size, fix memory leak, model scheduling",
},
"accuracy_degradation": {
"name": "Accuracy Degradation",
"severity": "P2",
"symptoms": "Model output ไม่ถูกต้อง, metrics drop",
"root_causes": [
"INT8 quantization ไม่ดี — calibration dataset ไม่ representative",
"FP16 overflow/underflow — บาง layers ต้อง keep FP32",
"Input data distribution shift — data ใหม่ต่างจาก training",
"TensorRT version mismatch — engine built กับ version เก่า",
],
"resolution": "Re-calibrate INT8, mixed precision, retrain model",
},
"engine_build_failure": {
"name": "TensorRT Engine Build Failure",
"severity": "P2",
"symptoms": "trtexec fails, unsupported ops error",
"root_causes": [
"Unsupported ONNX operators — ต้อง custom plugin",
"Dynamic shapes config ผิด",
"ONNX opset version ไม่ compatible",
"GPU architecture mismatch — build บน GPU อื่น",
],
"resolution": "Fix ONNX export, add custom plugins, match GPU arch",
},
}
def show_incidents(self):
print("=== Common Incidents ===\n")
for key, inc in self.INCIDENTS.items():
print(f"[{inc['severity']}] {inc['name']}")
print(f" Symptoms: {inc['symptoms']}")
print(f" Root causes:")
for cause in inc['root_causes'][:3]:
print(f" • {cause}")
print()
incidents = TensorRTIncidents()
incidents.show_incidents()
Python Incident Detection
# detection.py — Automated incident detection for TensorRT
import json
class IncidentDetection:
CODE = """
# trt_monitor.py — Monitor TensorRT inference in production
import time
import numpy as np
from prometheus_client import Histogram, Counter, Gauge, start_http_server
import logging
logger = logging.getLogger(__name__)
# Prometheus metrics
INFERENCE_LATENCY = Histogram(
'trt_inference_latency_seconds',
'TensorRT inference latency',
buckets=[0.001, 0.005, 0.01, 0.025, 0.05, 0.1, 0.25, 0.5, 1.0]
)
INFERENCE_ERRORS = Counter('trt_inference_errors_total', 'Total inference errors', ['error_type'])
GPU_MEMORY_USED = Gauge('trt_gpu_memory_used_bytes', 'GPU memory usage')
GPU_UTILIZATION = Gauge('trt_gpu_utilization_percent', 'GPU utilization')
MODEL_ACCURACY = Gauge('trt_model_accuracy', 'Model accuracy score')
class TensorRTMonitor:
def __init__(self, latency_threshold_ms=50, accuracy_threshold=0.95):
self.latency_threshold = latency_threshold_ms / 1000
self.accuracy_threshold = accuracy_threshold
self.latency_window = []
self.window_size = 100
def record_inference(self, latency_sec, success=True, error_type=None):
INFERENCE_LATENCY.observe(latency_sec)
if not success:
INFERENCE_ERRORS.labels(error_type=error_type or 'unknown').inc()
self.latency_window.append(latency_sec)
if len(self.latency_window) > self.window_size:
self.latency_window.pop(0)
# Check for latency anomaly
if len(self.latency_window) >= 10:
p99 = np.percentile(self.latency_window, 99)
if p99 > self.latency_threshold:
self._alert("latency_spike", f"P99 latency: {p99*1000:.1f}ms > {self.latency_threshold*1000}ms")
def check_gpu_health(self):
import pynvml
pynvml.nvmlInit()
handle = pynvml.nvmlDeviceGetHandleByIndex(0)
mem_info = pynvml.nvmlDeviceGetMemoryInfo(handle)
util = pynvml.nvmlDeviceGetUtilizationRates(handle)
temp = pynvml.nvmlDeviceGetTemperature(handle, pynvml.NVML_TEMPERATURE_GPU)
GPU_MEMORY_USED.set(mem_info.used)
GPU_UTILIZATION.set(util.gpu)
# Check thresholds
mem_pct = mem_info.used / mem_info.total * 100
if mem_pct > 90:
self._alert("gpu_memory_high", f"GPU memory: {mem_pct:.0f}%")
if temp > 85:
self._alert("gpu_thermal", f"GPU temp: {temp}°C")
return {"memory_pct": mem_pct, "utilization": util.gpu, "temperature": temp}
def check_accuracy(self, predictions, ground_truth):
accuracy = np.mean(np.array(predictions) == np.array(ground_truth))
MODEL_ACCURACY.set(accuracy)
if accuracy < self.accuracy_threshold:
self._alert("accuracy_drop", f"Accuracy: {accuracy:.3f} < {self.accuracy_threshold}")
return accuracy
def _alert(self, alert_type, message):
logger.warning(f"ALERT [{alert_type}]: {message}")
# Send to Slack, PagerDuty, etc.
# monitor = TensorRTMonitor(latency_threshold_ms=50)
# start_http_server(8000) # Prometheus metrics endpoint
"""
def show_code(self):
print("=== Incident Detection ===")
print(self.CODE[:600])
detection = IncidentDetection()
detection.show_code()
Incident Response Playbooks
# playbooks.py — Incident response playbooks
import json
import random
class IncidentPlaybooks:
PLAYBOOKS = {
"latency_spike": {
"name": "Latency Spike Playbook",
"steps": [
"1. Check GPU utilization (nvidia-smi) — ถ้า > 95% อาจ overloaded",
"2. Check GPU temperature — ถ้า > 85°C อาจ thermal throttle",
"3. Check CUDA context — ดู process อื่นที่ใช้ GPU",
"4. Check TensorRT engine — rebuild ถ้า version mismatch",
"5. Restart inference server — clear memory fragmentation",
"6. Scale out — เพิ่ม replicas ถ้า load สูง",
],
},
"oom_error": {
"name": "OOM Error Playbook",
"steps": [
"1. Check batch size — ลด batch size ทันที",
"2. nvidia-smi — ดู memory usage ของทุก processes",
"3. Kill unused processes ที่ใช้ GPU memory",
"4. Check memory leak — monitor memory growth over time",
"5. Optimize model — ใช้ FP16, reduce max workspace size",
"6. Long-term: model partitioning หรือ multi-GPU",
],
},
"accuracy_drop": {
"name": "Accuracy Drop Playbook",
"steps": [
"1. Compare outputs — TensorRT vs original model (same input)",
"2. Check INT8 calibration — re-calibrate ด้วย recent data",
"3. Check input data — distribution shift detection",
"4. Rollback — ใช้ FP16 engine แทน INT8 ชั่วคราว",
"5. Retrain model — ถ้า data drift เป็นสาเหตุ",
"6. Update monitoring — เพิ่ม accuracy checks",
],
},
}
def show_playbooks(self):
print("=== Incident Playbooks ===\n")
for key, pb in self.PLAYBOOKS.items():
print(f"[{pb['name']}]")
for step in pb['steps'][:4]:
print(f" {step}")
print()
def incident_dashboard(self):
print("=== TensorRT Incident Dashboard ===")
print(f" Inference P50: {random.uniform(3, 10):.1f}ms")
print(f" Inference P99: {random.uniform(15, 50):.1f}ms")
print(f" GPU Util: {random.randint(60, 95)}%")
print(f" GPU Temp: {random.randint(55, 80)}°C")
print(f" GPU Memory: {random.randint(40, 85)}%")
print(f" Error rate: {random.uniform(0, 0.5):.2f}%")
print(f" Active incidents: {random.randint(0, 2)}")
pb = IncidentPlaybooks()
pb.show_playbooks()
pb.incident_dashboard()
Optimization Best Practices
# best_practices.py — TensorRT optimization best practices
import json
class OptimizationBestPractices:
PRACTICES = {
"precision": {
"name": "Precision Selection",
"tips": [
"เริ่มจาก FP16 — balance ดีระหว่าง speed + accuracy",
"INT8: ใช้เมื่อต้องการ max speed + มี calibration data ดี",
"Mixed precision: บาง layers FP32 + ที่เหลือ FP16/INT8",
"Validate accuracy หลัง quantization ทุกครั้ง",
],
},
"batching": {
"name": "Dynamic Batching",
"tips": [
"ใช้ Triton dynamic batching — รวม requests เป็น batch",
"ตั้ง max_batch_size ตาม GPU memory",
"Preferred batch sizes: 1, 2, 4, 8, 16, 32",
"Monitor batch latency vs throughput tradeoff",
],
},
"memory": {
"name": "Memory Management",
"tips": [
"ใช้ CUDA memory pools — ลด allocation overhead",
"Set max_workspace_size ให้เหมาะสม (ไม่ใหญ่เกินไป)",
"Model loading: load/unload ตาม traffic pattern",
"Monitor memory growth — detect leaks เร็ว",
],
},
"ci_cd": {
"name": "CI/CD for TensorRT",
"tips": [
"Build TensorRT engine ใน CI — match target GPU architecture",
"Automated accuracy tests หลัง optimization",
"Performance benchmark ทุก build — detect regression",
"Canary deployment — ทดสอบ engine ใหม่กับ 5% traffic ก่อน",
],
},
}
def show_practices(self):
print("=== Best Practices ===\n")
for key, practice in self.PRACTICES.items():
print(f"[{practice['name']}]")
for tip in practice['tips'][:3]:
print(f" • {tip}")
print()
bp = OptimizationBestPractices()
bp.show_practices()
FAQ - คำถามที่พบบ่อย
Q: TensorRT เร็วกว่า PyTorch/ONNX Runtime แค่ไหน?
A: โดยทั่วไป: FP32: เร็วกว่า 1.5-3x FP16: เร็วกว่า 2-5x INT8: เร็วกว่า 3-6x ขึ้นกับ: model architecture, GPU, batch size, input size ResNet-50 example: PyTorch ~15ms → TensorRT FP16 ~3ms → INT8 ~1.5ms
Q: INT8 quantization ทำให้ accuracy ลดลงมากไหม?
A: ถ้า calibrate ดี: accuracy ลด < 1% โดยทั่วไป Calibration สำคัญมาก — ใช้ representative dataset (500-1000 samples) บาง models sensitive มากกว่า (NLP > CV โดยทั่วไป) ถ้า accuracy drop มาก: ใช้ mixed precision — sensitive layers keep FP32 ทดสอบ: เปรียบเทียบ output ทั้ง FP32, FP16, INT8 บน test set
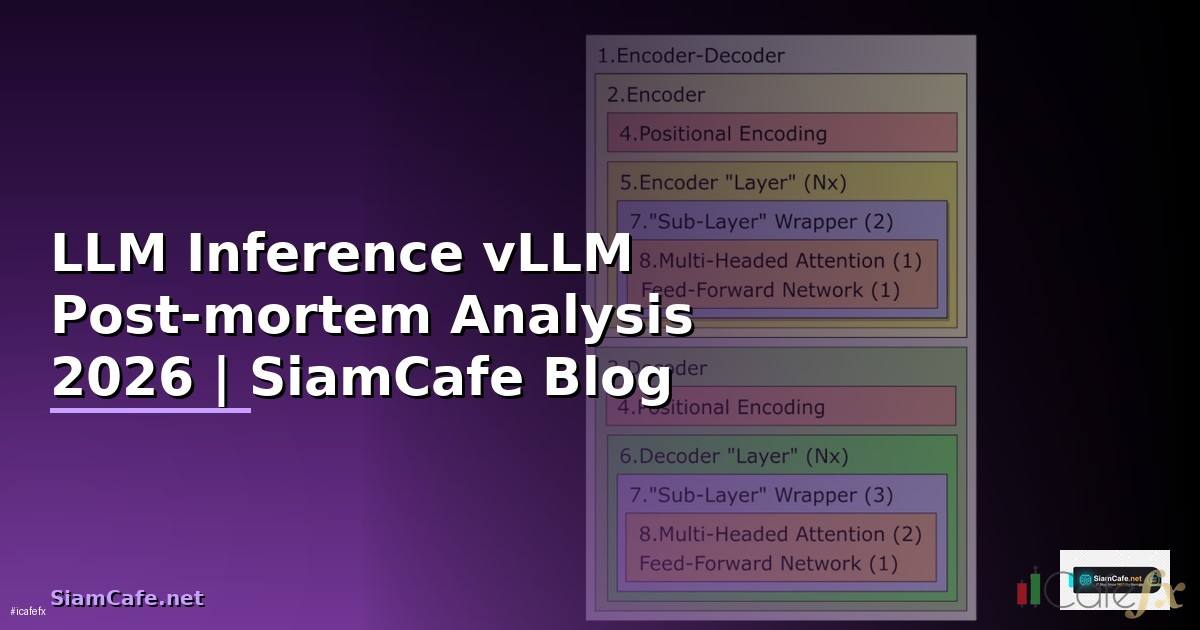
Q: TensorRT engine ใช้ข้าม GPU ได้ไหม?
A: ไม่ได้ — TensorRT engine ผูกกับ GPU architecture Engine build บน RTX 3080 (Ampere) ใช้บน RTX 4090 (Ada) ไม่ได้ ต้อง rebuild engine สำหรับทุก target GPU แก้: build engine ใน CI/CD → target GPU architecture flag ใช้ ONNX Runtime + TensorRT EP = flexible กว่า (rebuild อัตโนมัติ)
Q: Triton Inference Server จำเป็นไหม?
A: แนะนำอย่างยิ่งสำหรับ production: Dynamic batching — เพิ่ม throughput 2-5x Model management — load/unload models, A/B testing Multi-framework — รองรับ TensorRT, PyTorch, ONNX, TensorFlow Health checks + metrics — Prometheus integration built-in ถ้าแค่ prototype: FastAPI + TensorRT Python API ก็พอ
อ่านเพิ่มเติม: สอนเทรด Forex | XM Signal | IT Hardware | อาชีพ IT
