SiamCafe.net Blog
Cybersecurity

SASE Security Observability Stack

sase security observability stack
SASE Security Observability Stack | SiamCafe Blog
2026-04-27· อ. บอม — SiamCafe.net· 1,636 คำ

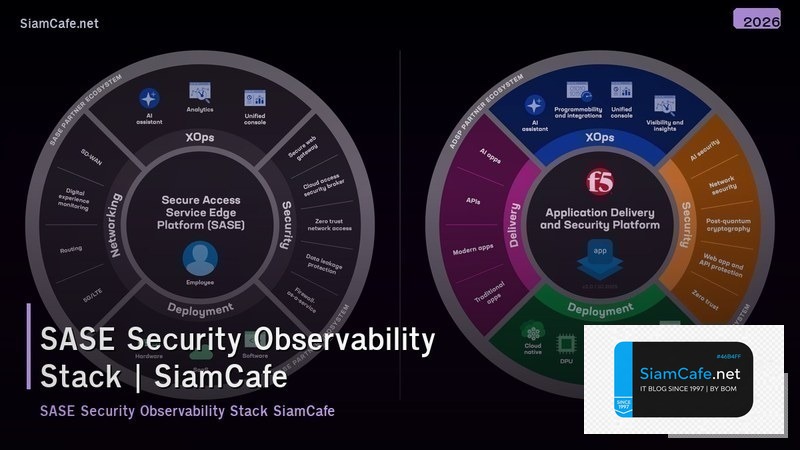
SASE Security Observability Stack คืออะไร

SASE (Secure Access Service Edge) รวม network security services เข้าด้วยกัน แต่การ monitor และ troubleshoot SASE infrastructure ต้องการ observability stack ที่ครอบคลุม Observability Stack คือชุดเครื่องมือสำหรับ collect, process และ visualize telemetry data ทั้ง 3 pillars: Logs, Metrics และ Traces สำหรับ SASE ต้องเพิ่ม security-specific observability เช่น threat detection, policy violations, anomaly detection และ compliance monitoring บทความนี้อธิบายการสร้าง observability stack สำหรับ SASE security ครบทุกด้าน

Observability Three Pillars

# three_pillars.py — Observability pillars for SASE
import json

class ObservabilityPillars:
    PILLARS = {
        "logs": {
            "name": "Logs",
            "description": "บันทึกเหตุการณ์ทุกอย่าง — access logs, policy decisions, threat events",
            "sase_sources": [
                "ZTNA access logs (who accessed what, when, from where)",
                "SWG web filtering logs (URLs blocked/allowed)",
                "CASB cloud app logs (shadow IT, DLP violations)",
                "Firewall logs (traffic allowed/denied)",
                "DNS query logs (malicious domain detection)",
            ],
            "tools": "ELK Stack, Splunk, Loki, Datadog Logs",
        },
        "metrics": {
            "name": "Metrics",
            "description": "ตัวเลขที่วัดได้ — latency, throughput, error rates, connection counts",
            "sase_sources": [
                "Tunnel latency per region",
                "Bandwidth utilization per policy",
                "Connection success/failure rates",
                "Policy evaluation time",
                "Threat detection counts",
            ],
            "tools": "Prometheus, Datadog, CloudWatch, Grafana Mimir",
        },
        "traces": {
            "name": "Traces",
            "description": "ติดตาม request path ผ่าน SASE components — debug latency issues",
            "sase_sources": [
                "User request → ZTNA → App (end-to-end trace)",
                "DNS query → SWG evaluation → internet (trace)",
                "CASB inspection → cloud app → response (trace)",
            ],
            "tools": "Jaeger, Tempo, Zipkin, Datadog APM",
        },
    }

    def show_pillars(self):
        print("=== Three Pillars of Observability ===\n")
        for key, pillar in self.PILLARS.items():
            print(f"[{pillar['name']}]")
            print(f"  {pillar['description']}")
            print(f"  SASE sources:")
            for src in pillar["sase_sources"][:3]:
                print(f"    • {src}")
            print(f"  Tools: {pillar['tools']}")
            print()

pillars = ObservabilityPillars()
pillars.show_pillars()

Stack Architecture

# stack_arch.py — SASE observability stack architecture
import json

class StackArchitecture:
    COMPONENTS = {
        "collection": {
            "name": "Collection Layer",
            "tools": {
                "otel_collector": "OpenTelemetry Collector — collect logs, metrics, traces จาก SASE APIs",
                "fluent_bit": "Fluent Bit — lightweight log forwarder",
                "telegraf": "Telegraf — metrics collection agent",
                "sase_exporters": "Custom exporters สำหรับ Zscaler/Prisma/Cloudflare APIs",
            },
        },
        "processing": {
            "name": "Processing Layer",
            "tools": {
                "kafka": "Apache Kafka — buffer + stream processing สำหรับ high-volume logs",
                "vector": "Vector — transform + route telemetry data",
                "flink": "Apache Flink — real-time anomaly detection",
            },
        },
        "storage": {
            "name": "Storage Layer",
            "tools": {
                "elasticsearch": "Elasticsearch — log storage + full-text search",
                "prometheus": "Prometheus/Mimir — time-series metrics",
                "tempo": "Grafana Tempo — distributed traces",
                "s3": "S3/MinIO — long-term archive (compliance)",
            },
        },
        "visualization": {
            "name": "Visualization & Alerting",
            "tools": {
                "grafana": "Grafana — unified dashboards สำหรับ logs, metrics, traces",
                "kibana": "Kibana — log analysis + visualization",
                "alertmanager": "Alertmanager — alert routing + escalation",
            },
        },
    }

    def show_stack(self):
        print("=== Observability Stack ===\n")
        for key, layer in self.COMPONENTS.items():
            print(f"[{layer['name']}]")
            for tool, desc in layer["tools"].items():
                print(f"  {tool}: {desc}")
            print()

stack = StackArchitecture()
stack.show_stack()

SASE Log Collection

# log_collection.py — Collect logs from SASE providers
import json

class SASELogCollection:
    CODE = """
# sase_collector.py — Collect SASE telemetry via APIs
import requests
import json
import time
from datetime import datetime, timedelta

class ZscalerLogCollector:
    def __init__(self, base_url, api_key, username, password):
        self.base_url = base_url
        self.session = requests.Session()
        self._authenticate(api_key, username, password)
    
    def _authenticate(self, api_key, username, password):
        resp = self.session.post(f"{self.base_url}/api/v1/authenticatedSession", json={
            "apiKey": api_key, "username": username, "password": password,
        })
        resp.raise_for_status()
    
    def get_web_logs(self, hours=1):
        '''Get SWG web transaction logs'''
        end = datetime.utcnow()
        start = end - timedelta(hours=hours)
        
        resp = self.session.get(f"{self.base_url}/api/v1/webApplicationRules", params={
            "startTime": int(start.timestamp()),
            "endTime": int(end.timestamp()),
            "page": 1,
            "pageSize": 1000,
        })
        return resp.json()
    
    def get_firewall_logs(self, hours=1):
        '''Get firewall logs'''
        end = datetime.utcnow()
        start = end - timedelta(hours=hours)
        
        resp = self.session.get(f"{self.base_url}/api/v1/firewallLogs", params={
            "startTime": int(start.timestamp()),
            "endTime": int(end.timestamp()),
        })
        return resp.json()
    
    def get_dns_logs(self, hours=1):
        '''Get DNS resolution logs'''
        resp = self.session.get(f"{self.base_url}/api/v1/dnsLogs", params={
            "duration": f"{hours}h",
        })
        return resp.json()
    
    def stream_to_siem(self, logs, siem_endpoint):
        '''Forward logs to SIEM/ELK'''
        for log in logs:
            log['@timestamp'] = datetime.utcnow().isoformat()
            log['source'] = 'zscaler'
            
            requests.post(siem_endpoint, json=log)

class CloudflareLogCollector:
    def __init__(self, api_token, zone_id):
        self.headers = {"Authorization": f"Bearer {api_token}"}
        self.zone_id = zone_id
    
    def get_gateway_logs(self, hours=1):
        '''Get Cloudflare Gateway logs'''
        resp = requests.get(
            f"https://api.cloudflare.com/client/v4/accounts/{self.zone_id}/gateway/logs",
            headers=self.headers,
            params={"limit": 1000}
        )
        return resp.json()

# collector = ZscalerLogCollector(...)
# logs = collector.get_web_logs(hours=1)
# collector.stream_to_siem(logs, "http://elasticsearch:9200/sase-logs/_doc")
"""

    def show_code(self):
        print("=== SASE Log Collector ===")
        print(self.CODE[:600])

collector = SASELogCollection()
collector.show_code()

Grafana Dashboards & Alerting

# dashboards.py — Grafana dashboards for SASE
import json
import random

class GrafanaDashboards:
    DASHBOARDS = {
        "overview": {
            "name": "SASE Overview Dashboard",
            "panels": [
                "Total connections (real-time counter)",
                "Blocked threats (time series)",
                "Policy violations (bar chart)",
                "Top blocked domains (table)",
                "User access heatmap (by time + region)",
                "Bandwidth usage per policy",
            ],
        },
        "threats": {
            "name": "Threat Detection Dashboard",
            "panels": [
                "Malware detected (counter + trend)",
                "Phishing attempts (time series)",
                "C2 communication blocked",
                "DNS tunneling detected",
                "Anomalous traffic patterns",
                "Threat severity distribution (pie)",
            ],
        },
        "compliance": {
            "name": "Compliance Dashboard",
            "panels": [
                "DLP violations by category",
                "Shadow IT apps detected",
                "Unapproved cloud storage usage",
                "Data exfiltration attempts",
                "Policy compliance score",
                "Audit trail completeness",
            ],
        },
    }

    ALERT_RULES = """
# alerting_rules.yml — Prometheus alert rules for SASE
groups:
  - name: sase_security
    rules:
      - alert: HighThreatRate
        expr: rate(sase_threats_total[5m]) > 10
        for: 2m
        labels:
          severity: critical
        annotations:
          summary: "High threat detection rate"
          description: "{{ $value }} threats/sec detected"

      - alert: PolicyViolationSpike
        expr: rate(sase_policy_violations_total[10m]) > 5
        for: 5m
        labels:
          severity: warning

      - alert: DLPDataExfiltration
        expr: sase_dlp_violations_total{category="data_exfiltration"} > 0
        for: 1m
        labels:
          severity: critical
        annotations:
          summary: "Potential data exfiltration detected"

      - alert: UnusualUserAccess
        expr: sase_access_anomaly_score > 0.8
        for: 3m
        labels:
          severity: warning
"""

    def show_dashboards(self):
        print("=== Grafana Dashboards ===\n")
        for key, dash in self.DASHBOARDS.items():
            print(f"[{dash['name']}]")
            for panel in dash["panels"][:4]:
                print(f"  • {panel}")
            print()

    def show_alerts(self):
        print("=== Alert Rules ===")
        print(self.ALERT_RULES[:500])

    def live_dashboard(self):
        print(f"\n=== Live SASE Dashboard ===")
        print(f"  Connections: {random.randint(5000, 50000):,} active")
        print(f"  Throughput: {random.uniform(1, 10):.1f} Gbps")
        print(f"  Threats blocked (24h): {random.randint(100, 5000):,}")
        print(f"  Policy violations (24h): {random.randint(10, 200)}")
        print(f"  DLP incidents (24h): {random.randint(0, 20)}")
        print(f"  Avg latency: {random.uniform(5, 30):.1f}ms")
        print(f"  Top threat: {'Malware' if random.random() > 0.5 else 'Phishing'}")

dash = GrafanaDashboards()
dash.show_dashboards()
dash.live_dashboard()

Anomaly Detection

# anomaly.py — Anomaly detection for SASE
import json
import random

class AnomalyDetection:
    CODE = """
# sase_anomaly.py — ML-based anomaly detection
import numpy as np
from sklearn.ensemble import IsolationForest
from sklearn.preprocessing import StandardScaler
import pandas as pd

class SASEAnomalyDetector:
    def __init__(self, contamination=0.05):
        self.model = IsolationForest(
            contamination=contamination,
            random_state=42,
            n_estimators=200,
        )
        self.scaler = StandardScaler()
        self.is_trained = False
    
    def prepare_features(self, logs_df):
        '''Extract features from SASE logs'''
        features = logs_df.groupby(['user_id', pd.Grouper(key='timestamp', freq='1H')]).agg({
            'bytes_sent': 'sum',
            'bytes_received': 'sum',
            'connections': 'count',
            'unique_destinations': 'nunique',
            'blocked_requests': 'sum',
            'off_hours': 'mean',
            'new_destinations': 'sum',
        }).reset_index()
        
        return features
    
    def train(self, historical_logs_df):
        '''Train on historical normal behavior'''
        features = self.prepare_features(historical_logs_df)
        X = features.select_dtypes(include=[np.number])
        
        self.scaler.fit(X)
        X_scaled = self.scaler.transform(X)
        
        self.model.fit(X_scaled)
        self.is_trained = True
    
    def detect(self, current_logs_df):
        '''Detect anomalies in current logs'''
        features = self.prepare_features(current_logs_df)
        X = features.select_dtypes(include=[np.number])
        X_scaled = self.scaler.transform(X)
        
        predictions = self.model.predict(X_scaled)
        scores = self.model.decision_function(X_scaled)
        
        features['is_anomaly'] = predictions == -1
        features['anomaly_score'] = -scores  # Higher = more anomalous
        
        return features[features['is_anomaly']]

# detector = SASEAnomalyDetector()
# detector.train(historical_df)
# anomalies = detector.detect(current_df)
"""

    def show_code(self):
        print("=== Anomaly Detection ===")
        print(self.CODE[:600])

    def sample_anomalies(self):
        print(f"\n=== Detected Anomalies ===")
        anomalies = [
            {"user": "user42", "type": "Data exfiltration", "score": random.uniform(0.85, 0.99)},
            {"user": "user107", "type": "Unusual access hours", "score": random.uniform(0.80, 0.95)},
            {"user": "user89", "type": "High blocked rate", "score": random.uniform(0.75, 0.90)},
        ]
        for a in anomalies:
            print(f"  [{a['score']:.2f}] {a['user']}: {a['type']}")

anomaly = AnomalyDetection()
anomaly.show_code()
anomaly.sample_anomalies()

FAQ - คำถามที่พบบ่อย

Q: SASE observability ต่างจาก traditional network monitoring อย่างไร?

A: Traditional: ดู bandwidth, packet loss, uptime ที่ network device level SASE observability: ดู user-centric metrics — ใครเข้าถึงอะไร, policy decisions, threat events, compliance ต้องเพิ่ม: security context (threat intel), identity context (user/device), policy context (allow/deny reasons) SASE data มาจาก cloud APIs ไม่ใช่ SNMP/NetFlow แบบ traditional

Q: ELK กับ Grafana Stack อันไหนดี?

A: ELK (Elasticsearch + Logstash + Kibana): ดีสำหรับ log analysis, full-text search, SIEM use cases Grafana Stack (Loki + Mimir + Tempo): ดีสำหรับ unified observability, correlation, cost-effective SASE: แนะนำ Grafana Stack — unified view ของ logs + metrics + traces ในที่เดียว ถ้ามี SIEM อยู่แล้ว (Splunk, ELK): forward SASE logs ไป SIEM + ใช้ Grafana สำหรับ operational dashboards

Q: Log volume มากแค่ไหน?

A: ขึ้นกับ user count + policy complexity: 1,000 users: ~10-50 GB/day 10,000 users: ~100-500 GB/day 100,000 users: ~1-5 TB/day ต้อง: retention policy (hot 7d, warm 30d, cold 1y), sampling สำหรับ high-volume, aggregation สำหรับ dashboards Cost management: ใช้ Loki (index-free) แทน Elasticsearch สำหรับ cost savings

Q: Anomaly detection จำเป็นไหม?

A: แนะนำอย่างยิ่ง: Rule-based alerts จับได้แค่ known threats — anomaly detection จับ unknown threats ตัวอย่าง: user upload 10x มากกว่าปกติ → อาจเป็น data exfiltration เริ่มจาก: simple statistical anomaly (z-score) → ML (Isolation Forest) → UEBA (User Entity Behavior Analytics) ลดเวลา detect threats จาก days → minutes

📖 บทความที่เกี่ยวข้อง

Hugo Module Observability Stackอ่านบทความ → Burp Suite Pro Observability Stackอ่านบทความ → SASE Security Distributed Systemอ่านบทความ → GitLab CI Include Observability Stackอ่านบทความ → GCP Anthos Observability Stackอ่านบทความ →

📚 ดูบทความทั้งหมด →