LocalAI Self-hosted กับ Monitoring และ Alerting


LocalAI Self-hosted LLM
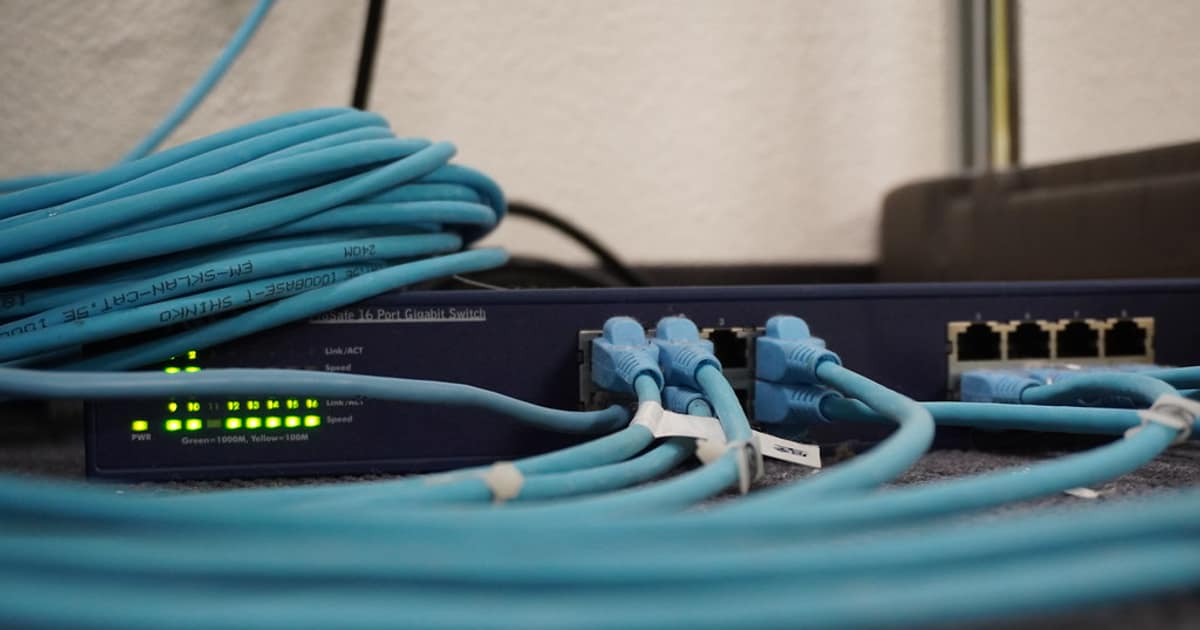
LocalAI เป็น Open-source API Server ที่ให้รัน Large Language Models บน Server เอง รองรับ OpenAI-compatible API ใช้แทน OpenAI ได้โดยเปลี่ยนแค่ Base URL ข้อมูลไม่ออกจากองค์กร ไม่มีค่า API ไม่มี Rate Limits
การ Monitor LocalAI สำคัญเพราะต้องติดตาม Performance, Resource Usage และ Error Rate ใช้ Prometheus เก็บ Metrics, Grafana แสดง Dashboard และ Alertmanager แจ้งเตือนเมื่อมีปัญหา
LocalAI Installation และ Configuration
# === LocalAI Setup ด้วย Docker ===

# 1. Docker Compose
cat > docker-compose.yml << 'EOF'
version: '3.8'
services:
  localai:
    image: localai/localai:latest-cpu
    # สำหรับ GPU: localai/localai:latest-gpu-nvidia-cuda-12
    ports:
      - "8080:8080"
    environment:
      - MODELS_PATH=/models
      - THREADS=8
      - CONTEXT_SIZE=4096
      - DEBUG=false
      - GALLERIES=[{"name":"model-gallery","url":"github:go-skynet/model-gallery/index.yaml"}]
    volumes:
      - ./models:/models
      - ./config:/config
    deploy:
      resources:
        limits:
          cpus: '8'
          memory: 16G
    restart: unless-stopped
    healthcheck:
      test: ["CMD", "curl", "-f", "http://localhost:8080/healthz"]
      interval: 30s
      timeout: 10s
      retries: 3

  prometheus:
    image: prom/prometheus:latest
    ports:
      - "9090:9090"
    volumes:
      - ./prometheus.yml:/etc/prometheus/prometheus.yml
      - prometheus-data:/prometheus
    restart: unless-stopped

  grafana:
    image: grafana/grafana:latest
    ports:
      - "3000:3000"
    environment:
      - GF_SECURITY_ADMIN_PASSWORD=admin123
    volumes:
      - grafana-data:/var/lib/grafana
    restart: unless-stopped

  alertmanager:
    image: prom/alertmanager:latest
    ports:
      - "9093:9093"
    volumes:
      - ./alertmanager.yml:/etc/alertmanager/alertmanager.yml
    restart: unless-stopped

volumes:
  prometheus-data:
  grafana-data:
EOF

# 2. ดาวน์โหลด Model
mkdir -p models

# Mistral 7B (Quantized Q4)
# wget -O models/mistral-7b-instruct-v0.2.Q4_K_M.gguf \
#   "https://huggingface.co/TheBloke/Mistral-7B-Instruct-v0.2-GGUF/resolve/main/mistral-7b-instruct-v0.2.Q4_K_M.gguf"

# 3. Model Configuration
cat > models/mistral.yaml << 'YAML'
name: mistral
backend: llama-cpp
parameters:
  model: mistral-7b-instruct-v0.2.Q4_K_M.gguf
  temperature: 0.7
  top_p: 0.9
  top_k: 40
  repeat_penalty: 1.1
  context_size: 4096
  threads: 8
  gpu_layers: 0
template:
  chat_message: |
    [INST] {{.Input}} [/INST]
  completion: |
    [INST] {{.Input}} [/INST]
YAML

# 4. เริ่ม Services
docker compose up -d

# 5. ทดสอบ API (OpenAI-compatible)
curl http://localhost:8080/v1/chat/completions \
  -H "Content-Type: application/json" \
  -d '{
    "model": "mistral",
    "messages": [{"role": "user", "content": "Hello, what is LocalAI?"}],
    "temperature": 0.7,
    "max_tokens": 200
  }'

# 6. ทดสอบ Embeddings
curl http://localhost:8080/v1/embeddings \
  -H "Content-Type: application/json" \
  -d '{
    "model": "mistral",
    "input": "Hello world"
  }'

echo "LocalAI running at http://localhost:8080"
echo "Prometheus at http://localhost:9090"
echo "Grafana at http://localhost:3000"
Monitoring Configuration
# === Prometheus + Alertmanager Configuration ===

# prometheus.yml
cat > prometheus.yml << 'YAML'
global:
  scrape_interval: 15s
  evaluation_interval: 15s

rule_files:
  - "alerts.yml"

alerting:
  alertmanagers:
    - static_configs:
        - targets: ["alertmanager:9093"]

scrape_configs:
  - job_name: "localai"
    static_configs:
      - targets: ["localai:8080"]
    metrics_path: /metrics

  - job_name: "prometheus"
    static_configs:
      - targets: ["localhost:9090"]

  - job_name: "node"
    static_configs:
      - targets: ["node-exporter:9100"]
YAML

# alerts.yml — Alert Rules
cat > alerts.yml << 'YAML'
groups:
  - name: localai_alerts
    rules:
      - alert: LocalAIHighLatency
        expr: histogram_quantile(0.99, rate(localai_request_duration_seconds_bucket[5m])) > 30
        for: 5m
        labels:
          severity: warning
        annotations:
          summary: "LocalAI P99 latency > 30s"
          description: "P99 latency is {{ $value }}s"

      - alert: LocalAIHighErrorRate
        expr: rate(localai_request_total{status="error"}[5m]) > 0.1
        for: 2m
        labels:
          severity: critical
        annotations:
          summary: "LocalAI error rate > 10%"

      - alert: LocalAIDown
        expr: up{job="localai"} == 0
        for: 1m
        labels:
          severity: critical
        annotations:
          summary: "LocalAI is down"

      - alert: HighMemoryUsage
        expr: process_resident_memory_bytes{job="localai"} / 1024^3 > 14
        for: 5m
        labels:
          severity: warning
        annotations:
          summary: "LocalAI memory > 14GB"

      - alert: HighCPUUsage
        expr: rate(process_cpu_seconds_total{job="localai"}[5m]) > 7
        for: 10m
        labels:
          severity: warning
        annotations:
          summary: "LocalAI CPU usage > 87.5% (7/8 cores)"
YAML

# alertmanager.yml
cat > alertmanager.yml << 'YAML'
global:
  resolve_timeout: 5m

route:
  group_by: ["alertname"]
  group_wait: 10s
  group_interval: 10s
  repeat_interval: 1h
  receiver: "slack"

receivers:
  - name: "slack"
    slack_configs:
      - api_url: "https://hooks.slack.com/services/YOUR/WEBHOOK/URL"
        channel: "#alerts"
        title: "{{ .GroupLabels.alertname }}"
        text: "{{ range .Alerts }}{{ .Annotations.summary }}\n{{ end }}"
YAML

echo "Monitoring configured"
echo "  Prometheus: scrape LocalAI /metrics every 15s"
echo "  Alerts: Latency, Error Rate, Down, Memory, CPU"
echo "  Alertmanager: Send to Slack"
Best Practices
- Quantized Models: ใช้ Q4_K_M หรือ Q5_K_M สมดุลระหว่าง Quality และ Speed
- Thread Tuning: ตั้ง Threads เท่ากับจำนวน Physical Cores (ไม่ใช่ Logical)
- Context Size: ตั้ง Context Size ให้พอดี ยิ่งมากยิ่งใช้ RAM มาก
- Health Check: ตั้ง Health Check ใน Docker Compose ตรวจสอบทุก 30 วินาที
- Alerting: ตั้ง Alert สำหรับ Latency สูง, Error Rate, Memory, Service Down
- Backup Models: เก็บ Model Files ใน Shared Storage สำหรับ Disaster Recovery
การดูแลระบบในสภาพแวดล้อม Production
การบริหารจัดการระบบ Production ที่ดีต้องมี Monitoring ครอบคลุม ใช้เครื่องมืออย่าง Prometheus + Grafana สำหรับ Metrics Collection และ Dashboard หรือ ELK Stack สำหรับ Log Management ตั้ง Alert ให้แจ้งเตือนเมื่อ CPU เกิน 80% RAM ใกล้เต็ม หรือ Disk Usage สูง
เนื้อหาเกี่ยวข้อง — ดูเพิ่มเติมเรื่อง economic calendar 2021
Backup Strategy ต้องวางแผนให้ดี ใช้หลัก 3-2-1 คือ มี Backup อย่างน้อย 3 ชุด เก็บใน Storage 2 ประเภทต่างกัน และ 1 ชุดต้องอยู่ Off-site ทดสอบ Restore Backup เป็นประจำ อย่างน้อยเดือนละครั้ง เพราะ Backup ที่ Restore ไม่ได้ก็เหมือนไม่มี Backup
เรื่อง Security Hardening ต้องทำตั้งแต่เริ่มต้น ปิด Port ที่ไม่จำเป็น ใช้ SSH Key แทน Password ตั้ง Fail2ban ป้องกัน Brute Force อัพเดท Security Patch สม่ำเสมอ และทำ Vulnerability Scanning อย่างน้อยเดือนละครั้ง ใช้หลัก Principle of Least Privilege ให้สิทธิ์น้อยที่สุดที่จำเป็น
แนะนำเพิ่มเติม — สัญญาณเทรดรายวัน XM Signal
เนื้อหาเกี่ยวข้อง — อ่านต่อ: Feature Store Feast Production Setup Guide
เปรียบเทียบข้อดีและข้อเสีย
จากตารางเปรียบเทียบจะเห็นว่าข้อดีมีมากกว่าข้อเสียอย่างชัดเจน โดยเฉพาะในแง่ของประสิทธิภาพและความสามารถในการ Scale สำหรับข้อเสียส่วนใหญ่สามารถแก้ไขได้ด้วยการเรียนรู้อย่างเป็นระบบและวางแผนทรัพยากรให้เหมาะสม
LocalAI คืออะไร
Open-source API Server รัน LLMs บน Server เอง OpenAI-compatible API รองรับ LLaMA Mistral Phi GPT4All รัน CPU ได้ ฟรีไม่มีค่า API
ทำไมต้อง Self-host LLM
Data Privacy ข้อมูลไม่ออกองค์กร ไม่มีค่า API Customization ปรับ Model ได้ Compliance ข้อมูลอยู่ Data Center No Rate Limits Offline ใช้ได้ไม่ต้องมี Internet
แนะนำเพิ่มเติม — หนังสือเทรดที่ SiamCafeBook
เนื้อหาเกี่ยวข้อง — บทความที่เกี่ยวข้อง: Multus CNI Backup Recovery Strategy —
LocalAI รันบน CPU ได้จริงหรือ
ได้ ใช้ llama.cpp Optimize สำหรับ CPU รองรับ AVX2 AVX512 ใช้ Quantized Models (Q4 Q5 Q8) Model 7B รัน CPU 8 Cores RAM 16GB ได้ ตอบ 5-15 tokens/second
วิธี Monitor LocalAI ทำอย่างไร
LocalAI มี /metrics Endpoint สำหรับ Prometheus ติดตาม Request Count Latency Token Speed Memory ใช้ Grafana Dashboard ตั้ง Alerting เมื่อ Latency สูง Error Rate เพิ่ม
เนื้อหาเกี่ยวข้อง — บทความที่เกี่ยวข้อง: OpenID Connect Home Lab Setup
สรุป
LocalAI เป็นทางเลือกที่ดีสำหรับรัน LLM บน Server เอง รองรับ OpenAI-compatible API รันบน CPU ได้ ข้อมูล Privacy ไม่มีค่า API ใช้ Docker Compose ติดตั้ง ตั้ง Prometheus Grafana Monitor Performance ตั้ง Alert สำหรับ Latency Error Rate Memory ใช้ Quantized Models สำหรับ Speed