Distributed Tracing CQRS Event Sourcing
Distributed Tracing CQRS Event Sourcing คืออะไร
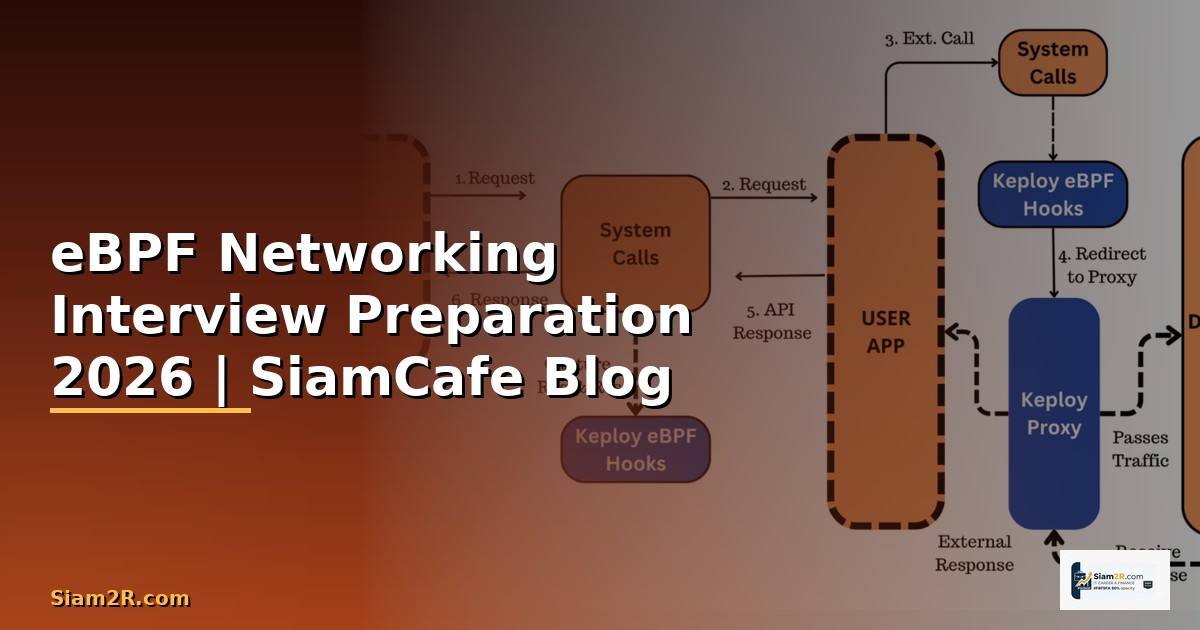
Distributed Tracing คือเทคนิคติดตาม requests ที่เดินทางผ่านหลาย microservices เพื่อ debug และ monitor ระบบ CQRS (Command Query Responsibility Segregation) คือ pattern ที่แยก read model กับ write model ออกจากกัน Event Sourcing คือการเก็บ state changes เป็น events แทนการเก็บ current state การรวมสามแนวคิดนี้ช่วยสร้างระบบ distributed ที่ traceable, scalable และ auditable บทความนี้อธิบาย architecture, implementation และ observability สำหรับระบบ CQRS + Event Sourcing ด้วย distributed tracing
Architecture Overview
# architecture.py — CQRS + Event Sourcing + Tracing

import json


class Architecture:

    COMPONENTS = {

        "command_side": {

            "name": "Command Side (Write)",

            "description": "รับ commands → validate → produce events → store in event store",

            "components": ["API Gateway", "Command Handler", "Aggregate", "Event Store"],

        },

        "query_side": {

            "name": "Query Side (Read)",

            "description": "Subscribe events → project เป็น read model → serve queries",

            "components": ["Event Consumer", "Projector", "Read Database", "Query API"],

        },

        "event_store": {

            "name": "Event Store",

            "description": "เก็บ events ทั้งหมดตามลำดับเวลา — single source of truth",

            "options": ["EventStoreDB", "Apache Kafka", "PostgreSQL (append-only)", "DynamoDB Streams"],

        },

        "tracing": {

            "name": "Distributed Tracing",

            "description": "ติดตาม trace ตั้งแต่ command → event → projection → query",

            "tools": ["OpenTelemetry", "Jaeger", "Zipkin", "Grafana Tempo"],

        },

    }


    FLOW = """

    CQRS + Event Sourcing Flow:


    [Client] → POST /orders (Command)

         ↓

    [Command API] → CreateOrderCommand

         ↓  (trace: span-1)

    [Command Handler] → validate + business logic

         ↓  (trace: span-2)

    [Aggregate] → produce OrderCreatedEvent

         ↓  (trace: span-3)

    [Event Store] → append event (Kafka/EventStoreDB)

         ↓  (trace: span-4, async)

    [Event Consumer] → read event

         ↓  (trace: span-5)

    [Projector] → update Read DB (PostgreSQL/Elasticsearch)

         ↓

    [Client] → GET /orders/123 (Query)

         ↓  (trace: span-6)

    [Query API] → read from Read DB → return response

    """


    def show_components(self):

        print("=== Architecture Components ===\n")

        for key, comp in self.COMPONENTS.items():

            print(f"[{comp['name']}]")

            print(f"  {comp['description']}")

            print()


    def show_flow(self):

        print("=== Request Flow ===")

        print(self.FLOW[:500])


arch = Architecture()

arch.show_components()

arch.show_flow()
Event Sourcing Implementation
# event_sourcing.py — Event Sourcing implementation

import json

from datetime import datetime


class EventStore:

    CODE = """

# event_store.py — Python Event Store implementation

import json

import uuid

from datetime import datetime

from dataclasses import dataclass, field, asdict


@dataclass

class Event:

    event_id: str = field(default_factory=lambda: str(uuid.uuid4()))

    event_type: str = ""

    aggregate_id: str = ""

    aggregate_type: str = ""

    data: dict = field(default_factory=dict)

    metadata: dict = field(default_factory=dict)

    timestamp: str = field(default_factory=lambda: datetime.utcnow().isoformat())

    version: int = 0


class EventStore:

    def __init__(self):

        self.events = []  # In production: use Kafka/EventStoreDB


    def append(self, event: Event):

        event.version = len([e for e in self.events if e.aggregate_id == event.aggregate_id]) + 1

        self.events.append(event)

        return event


    def get_events(self, aggregate_id):

        return [e for e in self.events if e.aggregate_id == aggregate_id]


    def get_all_events(self, event_type=None):

        if event_type:

            return [e for e in self.events if e.event_type == event_type]

        return self.events


class Aggregate:

    def __init__(self, aggregate_id):

        self.id = aggregate_id

        self.version = 0

        self.changes = []


    def apply_event(self, event):

        handler = getattr(self, f"on_{event.event_type}", None)

        if handler:

            handler(event.data)

        self.version += 1


    def load_from_history(self, events):

        for event in events:

            self.apply_event(event)


class OrderAggregate(Aggregate):

    def __init__(self, order_id):

        super().__init__(order_id)

        self.status = None

        self.items = []

        self.total = 0


    def create_order(self, items, customer_id):

        total = sum(i["price"] * i["qty"] for i in items)

        event = Event(

            event_type="OrderCreated",

            aggregate_id=self.id,

            aggregate_type="Order",

            data={"items": items, "customer_id": customer_id, "total": total},

        )

        self.changes.append(event)

        self.apply_event(event)

        return event


    def on_OrderCreated(self, data):

        self.status = "created"

        self.items = data["items"]

        self.total = data["total"]


# Usage

store = EventStore()

order = OrderAggregate("order-001")

event = order.create_order(

    items=[{"name": "Widget", "price": 100, "qty": 2}],

    customer_id="cust-123",

)

store.append(event)

print(f"Order: {order.id} | Status: {order.status} | Total: {order.total}")

"""


    def show_code(self):

        print("=== Event Sourcing Implementation ===")

        print(self.CODE[:600])


es = EventStore()

es.show_code()
Distributed Tracing with OpenTelemetry

# tracing.py — OpenTelemetry distributed tracing

import json


class DistributedTracing:

    SETUP = """

# tracing_setup.py — OpenTelemetry setup for CQRS

from opentelemetry import trace

from opentelemetry.sdk.trace import TracerProvider

from opentelemetry.sdk.trace.export import BatchSpanProcessor

from opentelemetry.exporter.jaeger.thrift import JaegerExporter

from opentelemetry.instrumentation.flask import FlaskInstrumentor

from opentelemetry.instrumentation.requests import RequestsInstrumentor

from opentelemetry.propagate import set_global_textmap

from opentelemetry.propagators.b3 import B3MultiFormat


# Setup tracer

provider = TracerProvider()

jaeger = JaegerExporter(agent_host_name="jaeger", agent_port=6831)

provider.add_span_processor(BatchSpanProcessor(jaeger))

trace.set_tracer_provider(provider)

tracer = trace.get_tracer("cqrs-service")


# Propagate trace context across services

set_global_textmap(B3MultiFormat())

"""


    COMMAND_TRACING = """

# command_tracing.py — Trace command handling

from opentelemetry import trace, context

from opentelemetry.trace import SpanKind


tracer = trace.get_tracer("command-service")


class TracedCommandHandler:

    def __init__(self, event_store):

        self.event_store = event_store


    def handle_create_order(self, command):

        with tracer.start_as_current_span(

            "handle_create_order",

            kind=SpanKind.SERVER,

            attributes={

                "command.type": "CreateOrder",

                "order.customer_id": command["customer_id"],

            },

        ) as span:

            # Validate

            with tracer.start_as_current_span("validate_command"):

                self._validate(command)


            # Create aggregate and events

            with tracer.start_as_current_span("create_aggregate") as agg_span:

                order = OrderAggregate(str(uuid.uuid4()))

                event = order.create_order(command["items"], command["customer_id"])

                agg_span.set_attribute("order.id", order.id)

                agg_span.set_attribute("order.total", order.total)


            # Store event (inject trace context into event metadata)

            with tracer.start_as_current_span("store_event", kind=SpanKind.PRODUCER) as store_span:

                # Inject trace context into event metadata for async propagation

                ctx = {}

                from opentelemetry.propagate import inject

                inject(ctx)

                event.metadata["trace_context"] = ctx


                self.event_store.append(event)

                store_span.set_attribute("event.type", event.event_type)

                store_span.set_attribute("event.id", event.event_id)


            span.set_attribute("result", "success")

            return {"order_id": order.id, "status": "created"}

"""


    EVENT_CONSUMER_TRACING = """

# consumer_tracing.py — Trace event consumption

tracer = trace.get_tracer("query-service")


class TracedEventConsumer:

    def process_event(self, event):

        # Extract trace context from event metadata

        ctx = event.metadata.get("trace_context", {})

        from opentelemetry.propagate import extract

        parent_ctx = extract(ctx)


        # Continue the trace from command service

        with tracer.start_as_current_span(

            "process_event",

            context=parent_ctx,

            kind=SpanKind.CONSUMER,

            attributes={

                "event.type": event.event_type,

                "event.aggregate_id": event.aggregate_id,

            },

        ):

            with tracer.start_as_current_span("project_read_model"):

                self._project(event)

"""


    def show_setup(self):

        print("=== OpenTelemetry Setup ===")

        print(self.SETUP[:500])


    def show_command(self):

        print(f"\n=== Command Tracing ===")

        print(self.COMMAND_TRACING[:500])


    def show_consumer(self):

        print(f"\n=== Event Consumer Tracing ===")

        print(self.EVENT_CONSUMER_TRACING[:400])


tracing = DistributedTracing()

tracing.show_setup()

tracing.show_command()
CQRS Read Model Projection
# projection.py — Read model projection

import json

import random


class ReadModelProjection:

    CODE = """

# projector.py — Event projector for read model

import json


class OrderProjector:

    def __init__(self, read_db):

        self.db = read_db


    def project(self, event):

        handler = getattr(self, f"on_{event.event_type}", None)

        if handler:

            handler(event)


    def on_OrderCreated(self, event):

        self.db.upsert("orders", {

            "id": event.aggregate_id,

            "customer_id": event.data["customer_id"],

            "items": event.data["items"],

            "total": event.data["total"],

            "status": "created",

            "created_at": event.timestamp,

            "version": event.version,

        })


    def on_OrderPaid(self, event):

        self.db.update("orders", event.aggregate_id, {

            "status": "paid",

            "paid_at": event.timestamp,

            "payment_method": event.data.get("method"),

        })


    def on_OrderShipped(self, event):

        self.db.update("orders", event.aggregate_id, {

            "status": "shipped",

            "shipped_at": event.timestamp,

            "tracking": event.data.get("tracking_number"),

        })


class QueryService:

    def __init__(self, read_db):

        self.db = read_db


    def get_order(self, order_id):

        return self.db.find("orders", order_id)


    def get_orders_by_customer(self, customer_id):

        return self.db.find_many("orders", {"customer_id": customer_id})


    def get_order_summary(self):

        orders = self.db.find_all("orders")

        return {

            "total_orders": len(orders),

            "total_revenue": sum(o["total"] for o in orders),

            "by_status": {s: len([o for o in orders if o["status"] == s])

                         for s in set(o["status"] for o in orders)},

        }

"""


    def show_code(self):

        print("=== Read Model Projection ===")

        print(self.CODE[:500])


    def query_dashboard(self):

        print(f"\n=== Order Query Dashboard ===")

        statuses = {"created": random.randint(10, 30), "paid": random.randint(20, 50), "shipped": random.randint(30, 80), "delivered": random.randint(50, 100)}

        total_revenue = random.randint(100000, 500000)

        print(f"  Total orders: {sum(statuses.values())}")

        print(f"  Total revenue: {total_revenue:,} บาท")

        for status, count in statuses.items():

            print(f"  [{status}]: {count}")


proj = ReadModelProjection()

proj.show_code()

proj.query_dashboard()
Infrastructure & Monitoring
# infra.py — Infrastructure setup

import json


class Infrastructure:

    DOCKER_COMPOSE = """

# docker-compose.yml — CQRS + Tracing infrastructure

version: '3.8'

services:

  # Event Store (Kafka)

  kafka:

    image: confluentinc/cp-kafka:7.5.0

    ports: ["9092:9092"]

    environment:

      KAFKA_BROKER_ID: 1

      KAFKA_ZOOKEEPER_CONNECT: zookeeper:2181

      KAFKA_ADVERTISED_LISTENERS: PLAINTEXT://kafka:9092


  zookeeper:

    image: confluentinc/cp-zookeeper:7.5.0

    environment:

      ZOOKEEPER_CLIENT_PORT: 2181


  # Read Database

  postgres:

    image: postgres:16

    environment:

      POSTGRES_DB: read_model

      POSTGRES_PASSWORD: password

    ports: ["5432:5432"]


  # Distributed Tracing

  jaeger:

    image: jaegertracing/all-in-one:latest

    ports:

      - "16686:16686"  # Jaeger UI

      - "6831:6831/udp"  # Jaeger agent

      - "4318:4318"  # OTLP HTTP

    environment:

      COLLECTOR_OTLP_ENABLED: "true"


  # Command Service

  command-service:

    build: ./command-service

    environment:

      KAFKA_BROKER: kafka:9092

      JAEGER_AGENT_HOST: jaeger

    depends_on: [kafka, jaeger]


  # Query Service

  query-service:

    build: ./query-service

    environment:

      DATABASE_URL: postgres://postgres:password@postgres:5432/read_model

      KAFKA_BROKER: kafka:9092

      JAEGER_AGENT_HOST: jaeger

    depends_on: [postgres, kafka, jaeger]

"""


    def show_compose(self):

        print("=== Docker Compose ===")

        print(self.DOCKER_COMPOSE[:600])


    def monitoring_tips(self):

        print(f"\n=== Monitoring Tips ===")

        tips = [

            "ใช้ trace_id เชื่อม command → event → projection → query",

            "ตั้ง alert เมื่อ event processing lag > threshold (e.g., 5s)",

            "Monitor read model consistency — compare event count vs projected count",

            "Track span duration สำหรับแต่ละ stage (command, store, consume, project)",

            "ใช้ Grafana dashboard รวม traces + metrics + logs",

        ]

        for tip in tips:

            print(f"  • {tip}")


infra = Infrastructure()

infra.show_compose()

infra.monitoring_tips()
FAQ - คำถามที่พบบ่อย
Q: CQRS กับ Event Sourcing ต้องใช้ด้วยกันเสมอไหม?
A: ไม่จำเป็น — ใช้แยกกันได้ CQRS อย่างเดียว: แยก read/write model แต่ไม่เก็บ events Event Sourcing อย่างเดียว: เก็บ events แต่ใช้ model เดียว ใช้ด้วยกัน: ได้ประโยชน์สูงสุด — audit trail, temporal queries, scalability แนะนำ: เริ่มจาก CQRS ก่อน → เพิ่ม Event Sourcing เมื่อจำเป็น
เนื้อหาเกี่ยวข้อง — Opsgenie Alert DNS Management
Q: Distributed Tracing จำเป็นไหม?
แนะนำเพิ่มเติม — หนังสือเทรดที่ SiamCafeBook
A: สำหรับ CQRS + Event Sourcing จำเป็นมาก เพราะ: 1) Request ผ่านหลาย services (command → event store → consumer → read DB) 2) Async processing ทำให้ debug ยาก ถ้าไม่มี trace 3) ต้อง correlate command กับ event กับ projection Tools: OpenTelemetry (standard) + Jaeger หรือ Grafana Tempo
เนื้อหาเกี่ยวข้อง — ดูเพิ่มเติมเรื่อง Delta Lake Observability Stack
Q: Event Store ใช้อะไรดี?
A: EventStoreDB: purpose-built, subscriptions, projections built-in Apache Kafka: scalable, ecosystem ใหญ่, ใช้เป็น event store + message broker PostgreSQL: ง่าย, append-only table, เหมาะเริ่มต้น เลือกตาม scale: เล็ก → PostgreSQL, กลาง → EventStoreDB, ใหญ่ → Kafka
แนะนำเพิ่มเติม — ระบบเทรดของ iCafeForex
เนื้อหาเกี่ยวข้อง — แนะนำให้อ่าน Azure Functions Service Mesh Setup
Q: Event Sourcing มีข้อเสียอะไร?
A: 1) Complexity สูง — เรียนรู้ยากกว่า CRUD 2) Event schema evolution — เปลี่ยน event format ต้องระวัง 3) Read model lag — eventual consistency ไม่ใช่ strong consistency 4) Storage — events สะสมมากขึ้นเรื่อยๆ (ต้อง snapshot) 5) Debugging — ต้องมี tooling ดี (tracing, event replay)
เนื้อหาเกี่ยวข้อง — บทความที่เกี่ยวข้อง: enumerate python คือ