it

ClickHouse Analytics Technical Debt Management — คู่มือฉบับสมบูรณ์ 2026

ClickHouse Analytics Technical Debt Management — คู่มือฉบับสมบูรณ์ 2026

ClickHouse Analytics Technical Debt Management คืออะไร

ClickHouse Analytics Technical Debt Management — คู่มือฉบับสมบูรณ์ 2026

ClickHouse เป็น open-source columnar database ที่ออกแบบมาสำหรับ OLAP (Online Analytical Processing) queries สามารถประมวลผล billions of rows ในเวลาไม่กี่วินาที Technical Debt (หนี้เทคนิค) คือต้นทุนที่เกิดจากการเลือก shortcut ในการพัฒนา software แทนที่จะทำวิธีที่ดีกว่าแต่ใช้เวลามากกว่า การใช้ ClickHouse วิเคราะห์และจัดการ Technical Debt ช่วยให้ทีม engineering เห็นภาพรวมของ codebase health ติดตาม debt metrics และตัดสินใจได้ว่าควร pay down debt เมื่อไหร่

Technical Debt Fundamentals

# tech_debt.py — Technical debt fundamentals

import json


class TechnicalDebtBasics:

 TYPES = {

 "deliberate": {

 "name": "Deliberate Debt (ตั้งใจ)",

 "description": "รู้ว่าเป็น shortcut แต่เลือกทำเพื่อ ship เร็ว — มี plan จะ fix",

 "example": "Skip unit tests เพื่อ meet deadline → plan refactor next sprint",

 },

 "accidental": {

 "name": "Accidental Debt (ไม่ตั้งใจ)",

 "description": "ไม่รู้ว่าเป็น debt — ขาด knowledge หรือ best practices",

 "example": "ใช้ pattern ที่ไม่เหมาะสม เพราะไม่รู้วิธีที่ดีกว่า",

 },

 "bit_rot": {

 "name": "Bit Rot (เสื่อมสภาพ)",

 "description": "Code เก่าที่ไม่ได้ maintain — dependencies outdated, standards เปลี่ยน",

 "example": "Library version เก่า 3+ ปี, deprecated APIs ที่ยังใช้อยู่",

 },

 "environmental": {

 "name": "Environmental Debt",

 "description": "Infrastructure, tooling, CI/CD ที่ล้าสมัยหรือ manual",

 "example": "Manual deployments, no CI/CD, outdated OS/runtime versions",

 },

 }


 METRICS = {

 "code_complexity": "Cyclomatic complexity — ยิ่งสูง ยิ่ง maintain ยาก",

 "code_duplication": "Duplicate code percentage — ยิ่งซ้ำ ยิ่ง debt สูง",

 "test_coverage": "Test coverage % — ต่ำ = high risk, debt compounds",

 "dependency_age": "อายุ dependencies — outdated = security + compatibility risk",

 "code_churn": "ไฟล์ที่แก้บ่อย — high churn = potential design problem",

 "bug_density": "Bugs per KLOC — สูง = code quality ต่ำ",

 "lead_time": "เวลาตั้งแต่ commit ถึง deploy — นาน = process debt",

 }


 def show_types(self):

 print("=== Technical Debt Types ===\n")

 for key, dt in self.TYPES.items():

 print(f"[{dt['name']}]")

 print(f" {dt['description']}")

 print(f" Example: {dt['example']}")

 print()


 def show_metrics(self):

 print("=== Debt Metrics ===")

 for metric, desc in self.METRICS.items():

 print(f" [{metric}] {desc}")


basics = TechnicalDebtBasics()

basics.show_types()

basics.show_metrics()

ClickHouse Analytics Schema

# schema.py — ClickHouse schema for tech debt analytics

import json


class ClickHouseSchema:

 TABLES = """

-- ClickHouse tables for technical debt analytics


-- Code metrics from SonarQube/CodeClimate

CREATE TABLE code_metrics (

 date Date,

 repo String,

 file_path String,

 language String,

 lines_of_code UInt32,

 cyclomatic_complexity UInt32,

 cognitive_complexity UInt32,

 duplication_pct Float32,

 test_coverage_pct Float32,

 code_smells UInt32,

 bugs UInt32,

 vulnerabilities UInt32,

 debt_minutes UInt32

) ENGINE = MergeTree()

PARTITION BY toYYYYMM(date)

ORDER BY (repo, file_path, date);


-- Dependency tracking

CREATE TABLE dependencies (

 date Date,

 repo String,

 package_name String,

 current_version String,

 latest_version String,

 versions_behind UInt32,

 days_outdated UInt32,

 has_vulnerabilities UInt8,

 severity String DEFAULT 'none'

) ENGINE = MergeTree()

PARTITION BY toYYYYMM(date)

ORDER BY (repo, package_name, date);


-- Code churn (from git)

CREATE TABLE code_churn (

 date Date,

 repo String,

 file_path String,

 author String,

 commits UInt32,

 lines_added UInt32,

 lines_deleted UInt32,

 churn_score Float32

) ENGINE = MergeTree()

PARTITION BY toYYYYMM(date)

ORDER BY (repo, file_path, date);


-- Tech debt items (tracked)

CREATE TABLE debt_items (

 id UUID DEFAULT generateUUIDv4(),

 created_date Date,

 repo String,

 title String,

 description String,

 category String,

 severity String,

 estimated_hours Float32,

 status String DEFAULT 'open',

 resolved_date Nullable(Date),

 assignee String DEFAULT ''

) ENGINE = MergeTree()

ORDER BY (repo, created_date, id);

"""


 def show_schema(self):

 print("=== ClickHouse Schema ===")

 print(self.TABLES[:600])


schema = ClickHouseSchema()

schema.show_schema()

Python Analytics Pipeline

ClickHouse Analytics Technical Debt Management — คู่มือฉบับสมบูรณ์ 2026
# pipeline.py — Python analytics pipeline for tech debt

import json


class DebtAnalyticsPipeline:

 CODE = """

# debt_analytics.py — Technical debt analytics with ClickHouse

import clickhouse_connect

import json

from datetime import datetime, timedelta


class TechDebtAnalytics:

 def __init__(self, host='localhost', port=8123):

 self.client = clickhouse_connect.get_client(host=host, port=port)


 def debt_overview(self, repo=None):

 '''Get technical debt overview'''

 where = f"WHERE repo = '{repo}'" if repo else ""


 result = self.client.query(f'''

 SELECT

 repo,

 sum(debt_minutes) / 60 as total_debt_hours,

 avg(cyclomatic_complexity) as avg_complexity,

 avg(duplication_pct) as avg_duplication,

 avg(test_coverage_pct) as avg_coverage,

 sum(code_smells) as total_smells,

 sum(bugs) as total_bugs,

 sum(vulnerabilities) as total_vulns

 FROM code_metrics

 WHERE date = (SELECT max(date) FROM code_metrics)

 {f"AND repo = '{repo}'" if repo else ""}

 GROUP BY repo

 ORDER BY total_debt_hours DESC

 ''')


 return [dict(zip(result.column_names, row)) for row in result.result_rows]


 def debt_trend(self, repo, days=90):

 '''Get debt trend over time'''

 result = self.client.query(f'''

 SELECT

 date,

 sum(debt_minutes) / 60 as debt_hours,

 avg(test_coverage_pct) as coverage,

 sum(code_smells) as smells,

 sum(bugs) as bugs

 FROM code_metrics

 WHERE repo = '{repo}'

 AND date >= today() - {days}

 GROUP BY date

 ORDER BY date

 ''')


 return [dict(zip(result.column_names, row)) for row in result.result_rows]


 def hotspot_files(self, repo, limit=20):

 '''Find files with highest debt + highest churn'''

 result = self.client.query(f'''

 SELECT

 m.file_path,

 m.cyclomatic_complexity,

 m.code_smells,

 m.debt_minutes / 60 as debt_hours,

 c.commits,

 c.churn_score,

 m.debt_minutes / 60 * c.churn_score as priority_score

 FROM code_metrics m

 JOIN code_churn c ON m.file_path = c.file_path AND m.repo = c.repo

 WHERE m.repo = '{repo}'

 AND m.date = (SELECT max(date) FROM code_metrics WHERE repo = '{repo}')

 AND c.date >= today() - 30

 ORDER BY priority_score DESC

 LIMIT {limit}

 ''')


 return [dict(zip(result.column_names, row)) for row in result.result_rows]


 def dependency_risk(self, repo=None):

 '''Analyze dependency risk'''

 where = f"WHERE repo = '{repo}'" if repo else ""


 result = self.client.query(f'''

 SELECT

 repo,

 countIf(versions_behind > 0) as outdated_deps,

 countIf(has_vulnerabilities = 1) as vulnerable_deps,

 avg(days_outdated) as avg_days_outdated,

 max(days_outdated) as max_days_outdated

 FROM dependencies

 WHERE date = (SELECT max(date) FROM dependencies)

 {f"AND repo = '{repo}'" if repo else ""}

 GROUP BY repo

 ORDER BY vulnerable_deps DESC

 ''')


 return [dict(zip(result.column_names, row)) for row in result.result_rows]


 def debt_report(self, repo):

 '''Generate comprehensive debt report'''

 overview = self.debt_overview(repo)

 trend = self.debt_trend(repo, 30)

 hotspots = self.hotspot_files(repo, 10)

 deps = self.dependency_risk(repo)


 # Calculate trend direction

 if len(trend) >= 2:

 recent = trend[-1]['debt_hours']

 older = trend[0]['debt_hours']

 direction = 'increasing' if recent > older else 'decreasing'

 else:

 direction = 'unknown'


 return {

 'repo': repo,

 'generated_at': datetime.utcnow().isoformat(),

 'overview': overview[0] if overview else {},

 'debt_direction': direction,

 'top_hotspots': hotspots[:5],

 'dependency_risk': deps[0] if deps else {},

 'recommendation': self._recommend(overview, hotspots, deps),

 }


 def _recommend(self, overview, hotspots, deps):

 recs = []

 if overview and overview[0].get('avg_coverage', 100) < 60:

 recs.append('Increase test coverage (currently below 60%)')

 if overview and overview[0].get('total_vulns', 0) > 0:

 recs.append('Fix security vulnerabilities immediately')

 if deps and deps[0].get('vulnerable_deps', 0) > 0:

 recs.append('Update vulnerable dependencies')

 if hotspots:

 recs.append(f'Refactor top hotspot: {hotspots[0]["file_path"]}')

 return recs


# analytics = TechDebtAnalytics()

# report = analytics.debt_report("my-app")

# hotspots = analytics.hotspot_files("my-app")

"""


 def show_code(self):

 print("=== Debt Analytics ===")

 print(self.CODE[:600])


pipeline = DebtAnalyticsPipeline()

pipeline.show_code()

Debt Management Strategies

# strategies.py — Technical debt management strategies

import json


class DebtStrategies:

 STRATEGIES = {

 "boy_scout": {

 "name": "Boy Scout Rule",

 "description": "ทุกครั้งที่แก้ code → ปรับปรุง code รอบๆ เล็กน้อย (leave it better)",

 "effort": "Low — ทำทีละนิดทุกวัน",

 "best_for": "Small, scattered debt — code smells, naming, small refactors",

 },

 "dedicated_sprint": {

 "name": "Dedicated Debt Sprint",

 "description": "จัด sprint เฉพาะสำหรับ pay down debt — ทุก 4-6 sprints",

 "effort": "High — 1-2 weeks focused effort",

 "best_for": "Large architectural debt, major refactoring",

 },

 "20_percent_rule": {

 "name": "20% Rule",

 "description": "จัดสรร 20% ของ capacity ในทุก sprint สำหรับ debt reduction",

 "effort": "Medium — consistent, sustainable",

 "best_for": "Balanced approach — maintain velocity + reduce debt",

 },

 "hotspot_driven": {

 "name": "Hotspot-Driven",

 "description": "Focus on files ที่มี high debt + high churn — ROI สูงสุด",

 "effort": "Medium — targeted effort",

 "best_for": "Limited time — maximize impact per hour invested",

 },

 }


 def show_strategies(self):

 print("=== Management Strategies ===\n")

 for key, s in self.STRATEGIES.items():

 print(f"[{s['name']}]")

 print(f" {s['description']}")

 print(f" Best for: {s['best_for']}")

 print()


strategies = DebtStrategies()

strategies.show_strategies()

Dashboard & Reporting

# dashboard.py — Tech debt dashboard

import json


class DebtDashboard:

 PANELS = {

 "overview": {

 "name": "Debt Overview",

 "queries": [

 "Total debt hours by repo",

 "Debt trend (last 90 days)",

 "Top 10 repos by debt",

 ],

 },

 "code_quality": {

 "name": "Code Quality",

 "queries": [

 "Average complexity by repo",

 "Test coverage trend",

 "Duplication percentage",

 "Code smells count",

 ],

 },

 "hotspots": {

 "name": "Hotspot Files",

 "queries": [

 "Files with high debt + high churn",

 "Most modified files (last 30 days)",

 "Files with 0% test coverage",

 ],

 },

 "dependencies": {

 "name": "Dependency Health",

 "queries": [

 "Outdated dependencies count",

 "Vulnerable dependencies (critical)",

 "Average dependency age",

 ],

 },

 }


 GRAFANA_SETUP = {

 "datasource": "ClickHouse plugin for Grafana — direct query",

 "refresh": "Daily (code metrics update nightly from CI)",

 "alerts": [

 "Debt hours increased > 10% in 1 week",

 "Test coverage dropped below 60%",

 "New critical vulnerability in dependencies",

 ],

 }


 def show_panels(self):

 print("=== Dashboard Panels ===\n")

 for key, panel in self.PANELS.items():

 print(f"[{panel['name']}]")

 for q in panel['queries'][:3]:

 print(f" • {q}")

 print()


 def show_setup(self):

 print("=== Grafana Setup ===")

 for key, val in self.GRAFANA_SETUP.items():

 if isinstance(val, list):

 print(f" [{key}]")

 for item in val:

 print(f" • {item}")

 else:

 print(f" [{key}] {val}")


dashboard = DebtDashboard()

dashboard.show_panels()

dashboard.show_setup()

FAQ - คำถามที่พบบ่อย

Q: ทำไมใช้ ClickHouse สำหรับ tech debt analytics?

A: ClickHouse เหมาะเพราะ: Columnar storage — aggregate queries เร็วมาก (sum, avg, count) Time-series friendly — ดู trends ได้ดี Handles large datasets — millions of code metrics rows ทางเลือก: PostgreSQL (เล็กกว่า), TimescaleDB, Prometheus (metrics only) ClickHouse ดีเมื่อ: หลาย repos, หลายปี history, complex analytics queries

เนื้อหาเกี่ยวข้อง — อ่านต่อ: Immutable OS Fedora CoreOS FinOps Cloud Cost

Q: Technical Debt ควรเป็น 0 ไหม?

แนะนำเพิ่มเติม — คอร์สเทรด Forex ที่ iCafeForex

A: ไม่ — debt เป็น 0 ไม่สมจริงและไม่จำเป็น: Deliberate debt บางอย่าง OK — trade-off ระหว่าง speed vs quality เป้าหมาย: ควบคุม debt ให้อยู่ในระดับที่ manage ได้ — ไม่เพิ่มขึ้นเรื่อยๆ กฎ: ถ้า debt ทำให้ delivery ช้าลง → ถึงเวลา pay down อันตราย: debt สะสมมากจน velocity ลดลง 50%+ → ต้อง major rewrite

เนื้อหาเกี่ยวข้อง — แนะนำให้อ่าน Cilium CNI Capacity Planning

Q: จะ convince management ให้จัด budget สำหรับ debt reduction อย่างไร?

A: ใช้ข้อมูล: แสดง velocity trend (ลดลงเพราะ debt), bug rate (เพิ่มขึ้น), MTTR (นานขึ้น) ROI: คำนวณ cost ของ debt — developer hours wasted per sprint × hourly rate Risk: security vulnerabilities, compliance issues, recruitment (devs ไม่อยากทำงานกับ legacy code) Proposal: 20% rule — ไม่ต้องหยุด feature development ทั้งหมด แค่จัดสรร 20%

แนะนำเพิ่มเติม — หนังสือเทรดที่ SiamCafeBook

เนื้อหาเกี่ยวข้อง — ดูเพิ่มเติมเรื่อง LocalAI Self-hosted Cloud Native Design

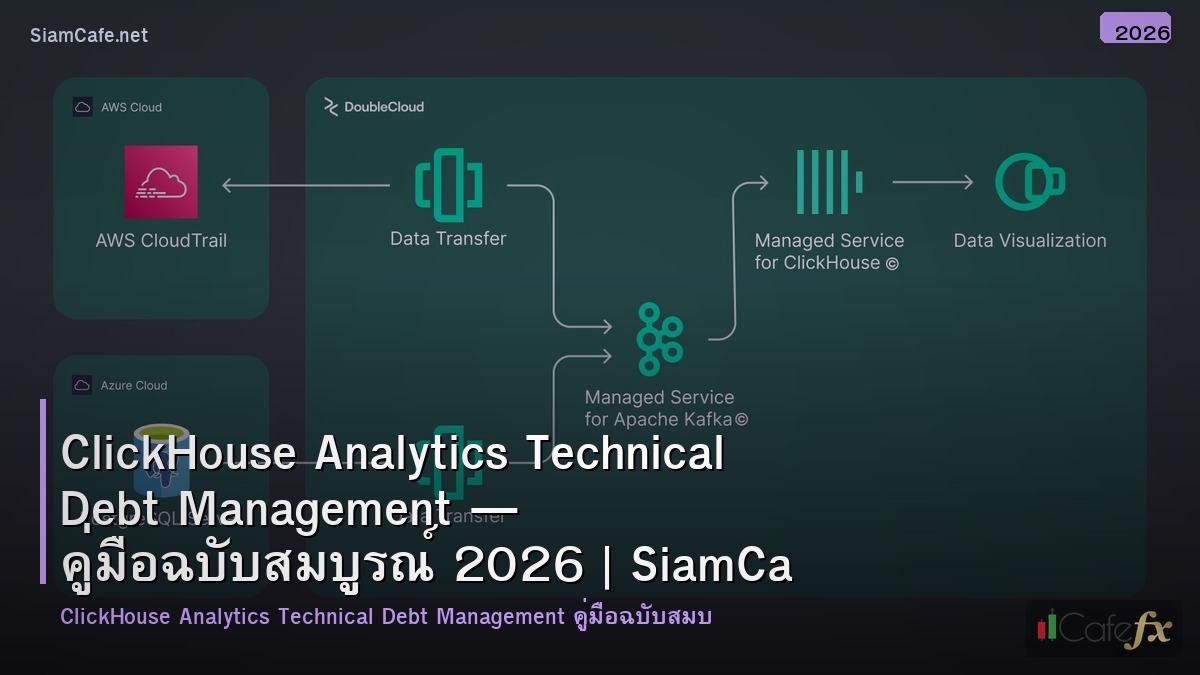
Q: Data pipeline สำหรับ tech debt analytics ทำอย่างไร?

A: Sources: SonarQube API (code metrics), GitHub API (churn, commits), Snyk/Dependabot (dependencies) Pipeline: CI/CD exports metrics daily → transform → load into ClickHouse Schedule: nightly batch — run after CI builds complete Tools: Python scripts + Airflow/Prefect สำหรับ orchestration Dashboard: Grafana + ClickHouse datasource — auto-refresh daily

เนื้อหาเกี่ยวข้อง — บทความที่เกี่ยวข้อง: Opsgenie Alert Performance Tuning เพิ่มความเร็ว

XM Legend · เทรดเดอร์ & ผู้สอน Forex 13 ปี

ผู้ก่อตั้ง SiamCafe ตั้งแต่ปี 1997 · เทรดเดอร์สาย Forex มากกว่า 13 ปี ได้รับการยกย่องเป็น XM Legend · แบ่งปันความรู้ Forex, ไอที, AI และการเทรด จากประสบการณ์จริงในตลาดจริง