C# Entity Framework Observability Stack —
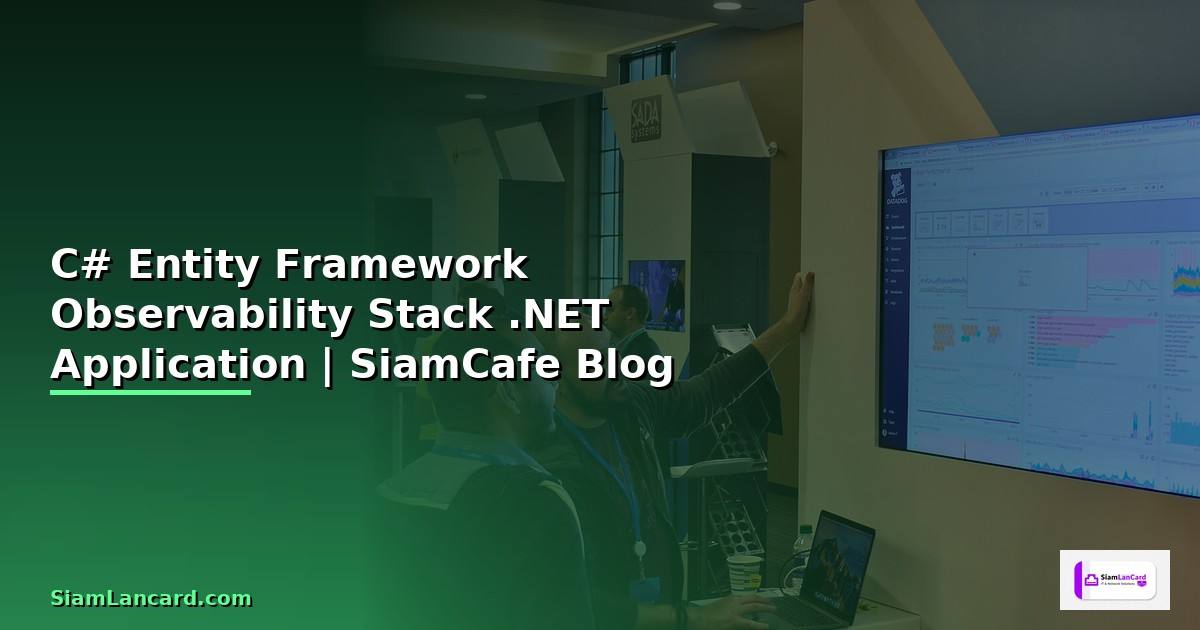
EF Core Observability
C# Entity Framework Core Observability OpenTelemetry Distributed Tracing Metrics Logging Serilog Prometheus Grafana Jaeger .NET ASP.NET Core SQL Performance Monitoring
| Signal | Tool | Backend | Dashboard | เหมาะกับ |
|---|---|---|---|---|
| Logging | Serilog | Seq / Elasticsearch | Kibana / Seq UI | Debug + Audit |
| Tracing | OpenTelemetry | Jaeger / Tempo | Grafana | Distributed |
| Metrics | Prometheus | Prometheus | Grafana | Performance |
| Health | HealthChecks | Built-in | Grafana | Uptime |
OpenTelemetry Setup
=== .NET OpenTelemetry Configuration ===
NuGet Packages:
dotnet add package OpenTelemetry.Extensions.Hosting
dotnet add package OpenTelemetry.Instrumentation.AspNetCore
dotnet add package OpenTelemetry.Instrumentation.SqlClient
dotnet add package OpenTelemetry.Instrumentation.EntityFrameworkCore
dotnet add package OpenTelemetry.Exporter.OpenTelemetryProtocol
dotnet add package OpenTelemetry.Exporter.Prometheus.AspNetCore
Program.cs
using OpenTelemetry.Metrics;
using OpenTelemetry.Resources;
using OpenTelemetry.Trace;
var builder = WebApplication.CreateBuilder(args);
builder.Services.AddOpenTelemetry()
.ConfigureResource(r => r
.AddService("MyApp", serviceVersion: "1.0.0"))
.WithTracing(tracing => tracing
.AddAspNetCoreInstrumentation()
.AddHttpClientInstrumentation()
.AddSqlClientInstrumentation(opt =>
{
opt.SetDbStatementForText = true;
opt.RecordException = true;
})
.AddEntityFrameworkCoreInstrumentation()
.AddOtlpExporter(opt =>
{
opt.Endpoint = new Uri("http://jaeger:4317");
}))
.WithMetrics(metrics => metrics
.AddAspNetCoreInstrumentation()
เนื้อหาเกี่ยวข้อง — อ่านต่อ: GIT คืออะไร — คู่มือโปรแกรมมิ่ง 2026
.AddHttpClientInstrumentation()
.AddRuntimeInstrumentation()
.AddPrometheusExporter());
DbContext
builder.Services.AddDbContext<AppDbContext>(options =>
options.UseSqlServer(connectionString)
.EnableSensitiveDataLogging()
.LogTo(Console.WriteLine, LogLevel.Information));
var app = builder.Build();
แนะนำเพิ่มเติม — หนังสือเทรดที่ SiamCafeBook
app.MapPrometheusScrapingEndpoint();
from dataclasses import dataclass
@dataclass
class TelemetrySignal:
signal: str
source: str
exporter: str
data_points: str
retention: str
signals = [
TelemetrySignal("Traces", "ASP.NET + EF Core + SQL", "OTLP -> Jaeger", "Spans per request", "7 days"),
TelemetrySignal("Metrics", "Runtime + HTTP + Custom", "Prometheus", "Counters, Histograms", "30 days"),
TelemetrySignal("Logs", "Serilog + EF Core", "Seq / Elasticsearch", "Structured JSON", "30 days"),
TelemetrySignal("Health", "DB + Redis + External", "HTTP endpoint", "Up/Down/Degraded", "Real-time"),
]
print("=== Telemetry Signals ===")
for s in signals:
print(f" [{s.signal}] {s.source}")
print(f" Exporter: {s.exporter} | Data: {s.data_points} | Retention: {s.retention}")
EF Core Performance
=== EF Core Performance Monitoring ===
Slow Query Interceptor
public class SlowQueryInterceptor : DbCommandInterceptor
{
private readonly ILogger _logger;
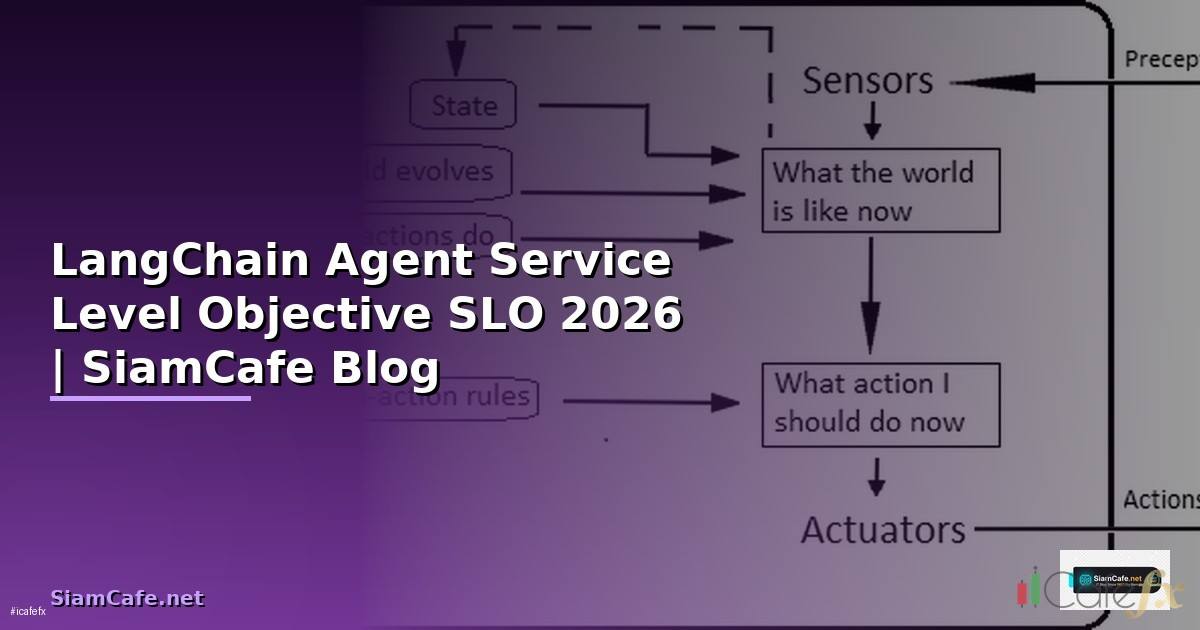
เนื้อหาเกี่ยวข้อง — แนะนำให้อ่าน LangChain Agent Service Level Objective SLO
private readonly TimeSpan _threshold = TimeSpan.FromMilliseconds(100);
public override DbDataReader ReaderExecuted(
DbCommand command,
CommandExecutedEventData eventData,
DbDataReader result)
{
if (eventData.Duration > _threshold)
{
_logger.LogWarning(
"Slow query ({Duration}ms): {Query}",
eventData.Duration.TotalMilliseconds,
command.CommandText);
}
return result;
}
}
Register in DbContext
แนะนำเพิ่มเติม — ติดตาม XM Signal
options.AddInterceptors(new SlowQueryInterceptor(logger));
MiniProfiler — In-page Query Profiling
dotnet add package MiniProfiler.EntityFrameworkCore
builder.Services.AddMiniProfiler(options =>
{
options.RouteBasePath = "/profiler";
options.SqlFormatter = new StackExchange.Profiling.SqlFormatters.InlineFormatter();
}).AddEntityFramework();
dotnet-counters — Real-time Metrics
dotnet-counters monitor \
--counters Microsoft.EntityFrameworkCore \
--process-id <PID>
Metrics:
- ec_Microsoft.EntityFrameworkCore|active-db-contexts
- ec_Microsoft.EntityFrameworkCore|total-queries
- ec_Microsoft.EntityFrameworkCore|total-save-changes
- ec_Microsoft.EntityFrameworkCore|compiled-query-cache-hit-rate
- ec_Microsoft.EntityFrameworkCore|total-execution-strategy-operation-failures
@dataclass
class QueryMetric:
query_type: str
เนื้อหาเกี่ยวข้อง — GCP Cloud Spanner Scaling Strategy วิธี Scale
count_24h: int
avg_ms: float
p99_ms: float
slow_count: int
cache_hit_pct: float
metrics = [
QueryMetric("SELECT (Read)", 45000, 12.5, 85, 23, 95.2),
QueryMetric("INSERT (Create)", 8000, 8.3, 45, 5, 0),
QueryMetric("UPDATE (Modify)", 5000, 15.2, 120, 12, 0),
QueryMetric("DELETE (Remove)", 1200, 6.1, 30, 1, 0),
QueryMetric("JOIN (Complex)", 3500, 45.8, 250, 45, 88.5),
QueryMetric("Stored Proc", 2000, 22.3, 150, 8, 0),
]
print("\n=== EF Core Query Metrics (24h) ===")
total_queries = sum(m.count_24h for m in metrics)
total_slow = sum(m.slow_count for m in metrics)
for m in metrics:
print(f" [{m.query_type}] Count: {m.count_24h:,}")
print(f" Avg: {m.avg_ms}ms | p99: {m.p99_ms}ms | Slow: {m.slow_count}")
print(f"\n Total: {total_queries:,} queries | Slow: {total_slow}")
Grafana Dashboard
=== Production Dashboard ===
Docker Compose — Observability Stack
services:
jaeger:
image: jaegertracing/all-in-one:latest
ports:
- "16686:16686" # Jaeger UI
- "4317:4317" # OTLP gRPC
prometheus:
image: prom/prometheus:latest
volumes:

- ./prometheus.yml:/etc/prometheus/prometheus.yml
ports:
- "9090:9090"
grafana:
image: grafana/grafana:latest
ports:
- "3000:3000"
environment:
- GF_SECURITY_ADMIN_PASSWORD=admin
seq:
image: datalust/seq:latest
ports:
- "5341:5341" # Ingestion
- "8080:80" # UI
environment:
- ACCEPT_EULA=Y
prometheus.yml
scrape_configs:
- job_name: 'dotnet-app'
scrape_interval: 15s
static_configs:
- targets: ['app:8080']
Grafana Dashboard Panels:
1. Request Rate (req/s)
2. Response Time (p50, p95, p99)
3. Error Rate (5xx %)
4. EF Core Query Count
เนื้อหาเกี่ยวข้อง — ทำความเข้าใจ Tripple Top — คู่มือ IT Infrastructure 2026
5. Slow Query Count
6. DB Connection Pool
7. GC Collections
8. Thread Pool Queue Length
dashboard_panels = {
"HTTP Request Rate": "125 req/s",
"Response Time p99": "180ms",
"Error Rate": "0.05%",
"EF Queries/sec": "85",
"Slow Queries (>100ms)": "12/hour",
"DB Connections (pool)": "18/100",
"GC Gen2 Collections": "3/min",
"Memory Usage": "450 MB",
"CPU Usage": "35%",
"Active Traces": "1,250",
}
print("Grafana Dashboard:")
for panel, value in dashboard_panels.items():
print(f" {panel}: {value}")
alerts = [
"p99 Latency > 500ms -> Warning (Slack)",
"Error Rate > 1% -> Critical (PagerDuty)",
"Slow Queries > 50/hour -> Warning (Slack)",
"DB Pool Exhaustion > 80% -> Critical (PagerDuty)",
"Memory > 1GB -> Warning (Slack)",
"Health Check Failed -> Critical (PagerDuty + SMS)",
]
print(f"\n\nAlert Rules:")
for i, a in enumerate(alerts, 1):
print(f" {i}. {a}")
เคล็ดลับ
- OTel: ใช้ OpenTelemetry เป็น Standard เดียวสำหรับทุก Signal
- Interceptor: สร้าง Slow Query Interceptor จับ Query ช้า
- MiniProfiler: ใช้ MiniProfiler ตอน Development ดู SQL
- Health: ตั้ง Health Check ตรวจ DB Redis ทุก Dependency
- Alert: Alert บน p99 Latency และ Error Rate เท่านั้น
Entity Framework Observability คืออะไร
ตรวจสอบ EF Core SQL Query Performance Slow Query Connection Pool OpenTelemetry Tracing Prometheus Metrics Grafana Dashboard Seq Elasticsearch Log